Just as one wouldn’t drive a car without a dashboard as it provides valuable information on the vehicle’s speed, gas level and so on, no construction project manager should try to deliver construction projects without a construction project dashboard. A construction dashboard is one of the pillars of construction project management.
Project management and program management both recommend using a construction project management dashboard and we’ll explain why. In the following blog, we break down what construction project managers should include in their construction management dashboard and even offer a free downloadable construction dashboard template to help get started.
What Is a Construction Project Dashboard?
A construction dashboard is a digital tool or interface that visually displays key data and metrics related to a construction project in real time. It helps project managers, contractors and stakeholders track the project’s progress, manage resources and make informed decisions.
The goal of a construction project dashboard is to provide a quick, easily digestible overview that allows teams to identify potential issues early, optimize performance and keep the project on track. While there are construction project dashboards for Excel, which we’ll get to in a moment, they’re not as efficient as ones that are part of a larger project management software.
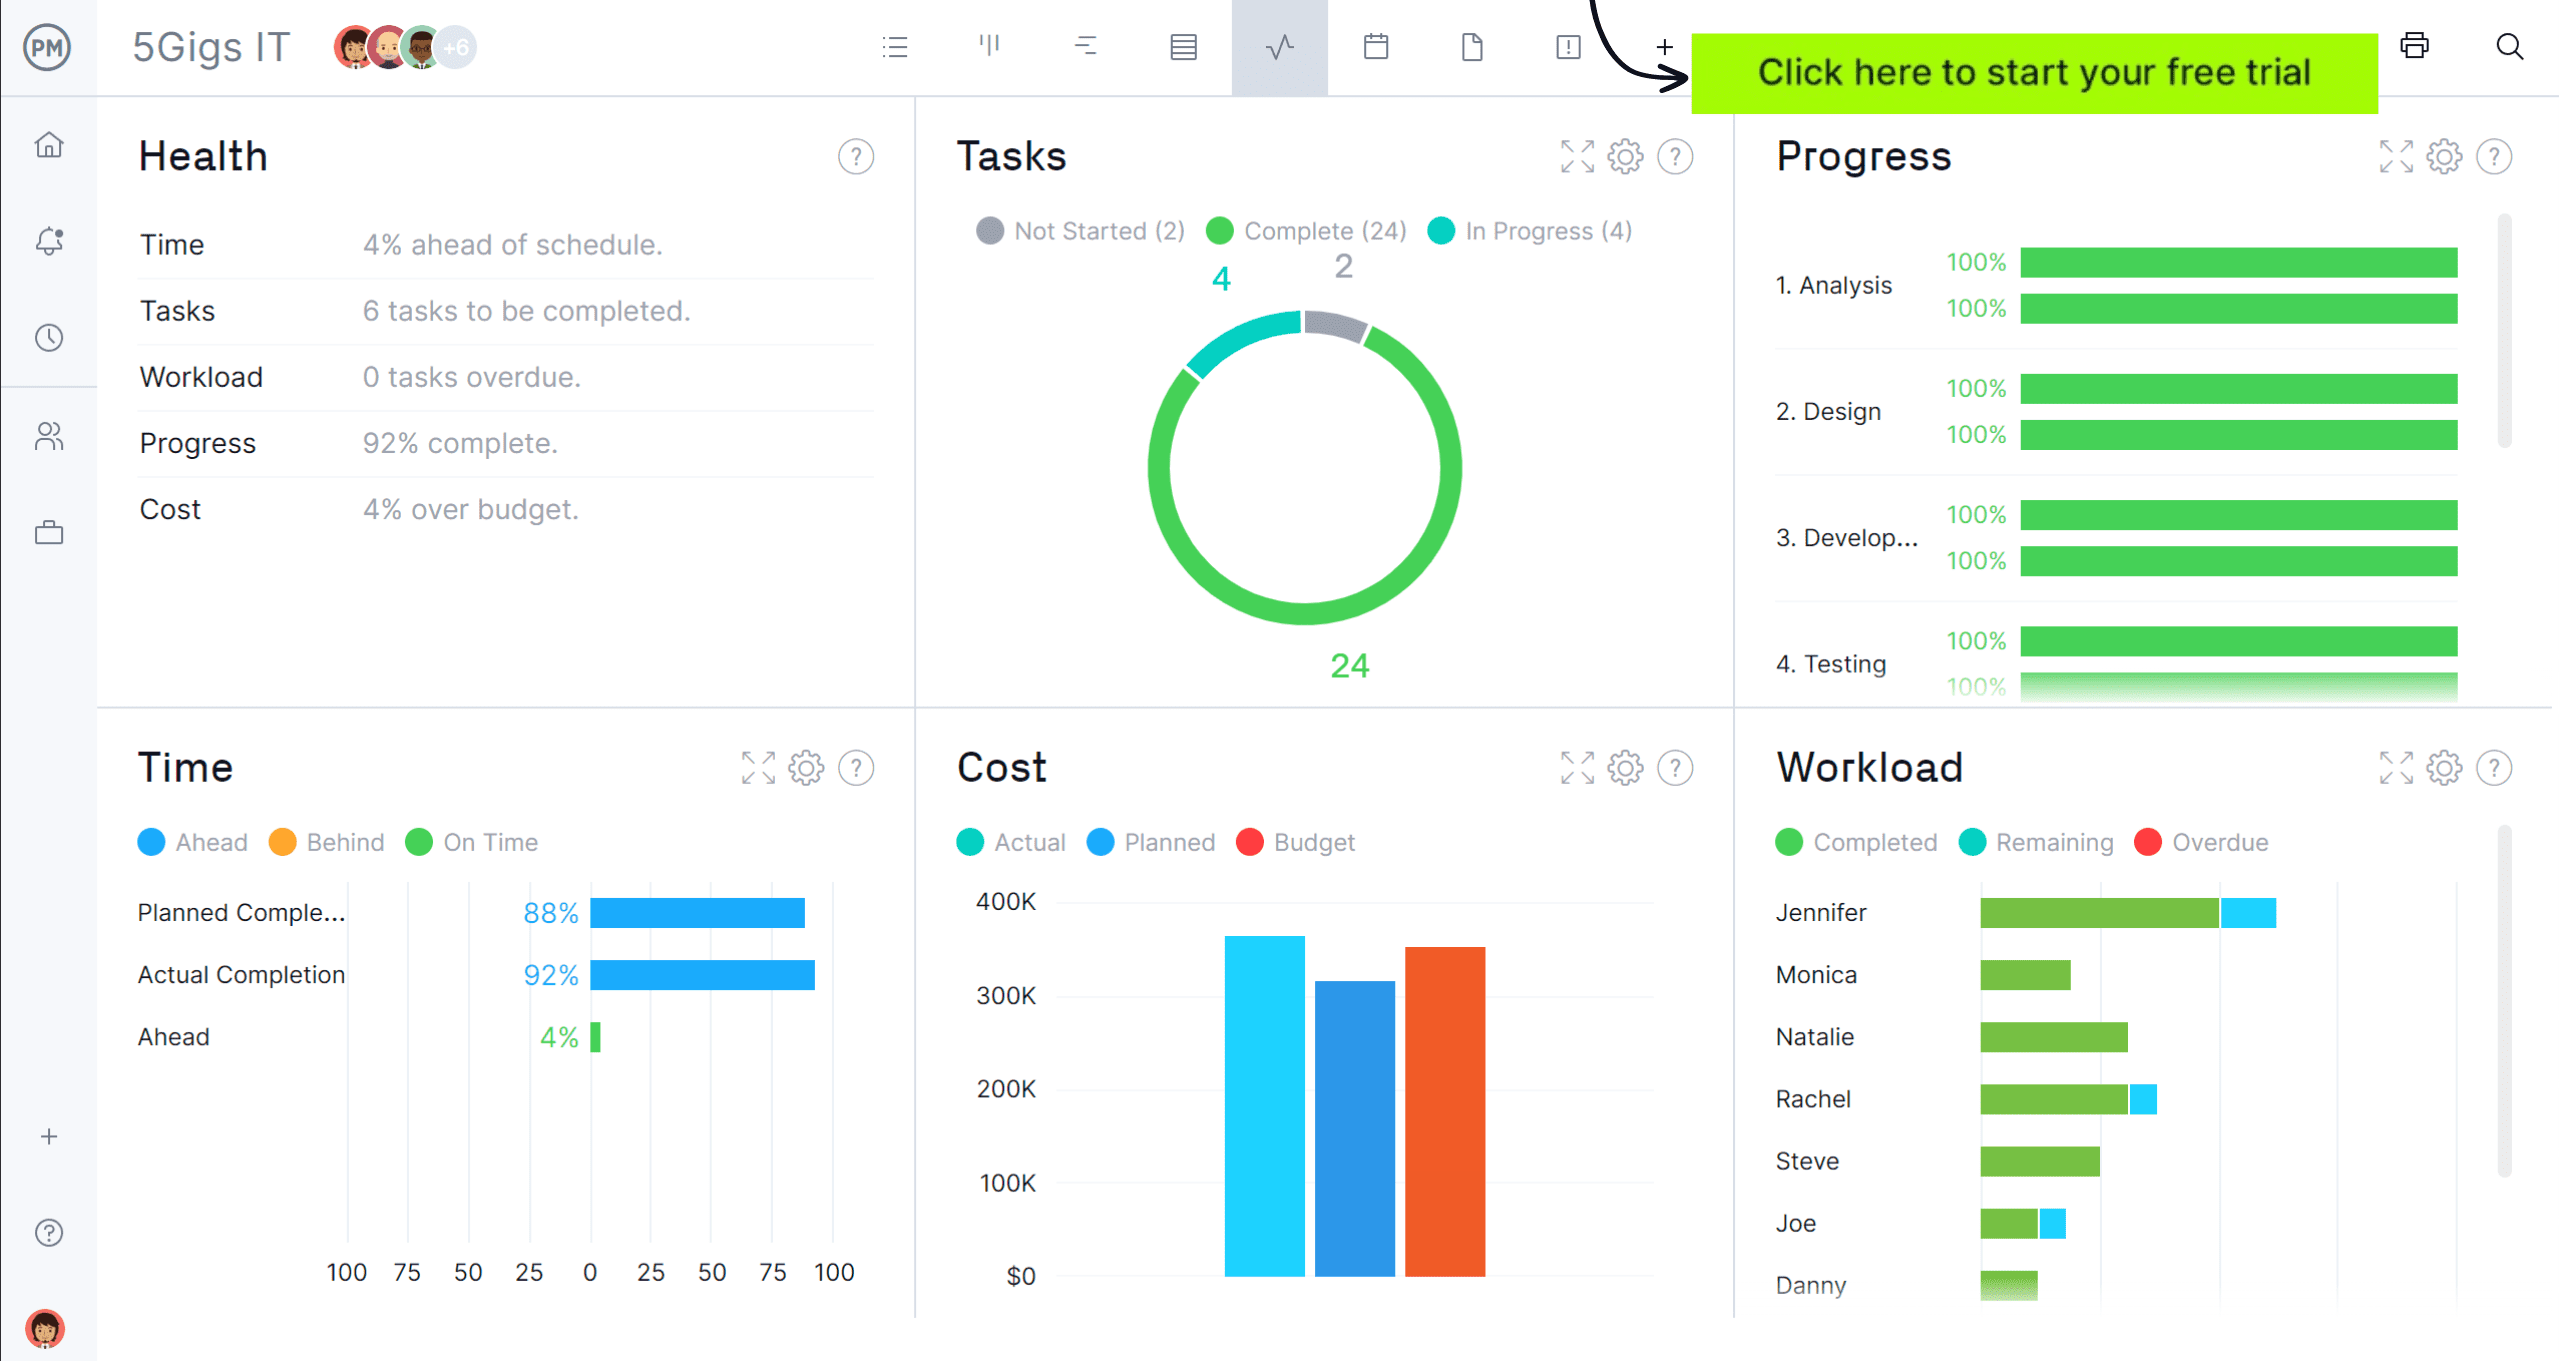
ProjectManager is award-winning project and portfolio management software that has real-time construction project dashboards that give a high-level overview of a project, program or portfolio of projects. Unlike other software products that make users build their dashboards, ours is up and ready to use instantly, with easy-to-read graphs and charts that show key performance indicators (KPIs) such as project health, budget, workload and more. Get started with ProjectManager today for free.
What Should Be Included in a Construction Project Dashboard?
A construction project management dashboard typically includes several key sections to provide a comprehensive overview of the project’s status. Here is a list of some of the most important metrics to look for when using a dashboard.
Project Progress Overview
This gives a snapshot of how the project is progressing relative to the original plan. It can include the percentage of work completed compared to the total project, key project milestones and whether they’ve been reached, an overview of the current status of critical tasks and a summary of current activity happening on-site, such as inspections, installations, etc.
Project Cost Overview
This section focuses on the financial aspects of the project. It includes a comparison between the initial budget and the actual costs incurred so far, a more granular view of costs, projected future costs and potential overages or savings and how money is flowing through the project and whether there are any concerns around cash flow management.
Project Timeline Overview
In this area of the construction project dashboard, insights into the scheduling and timeline of construction projects are provided. These can include a Gantt chart, which is a visual timeline showing the overall project and key activities. The critical path can also be illustrated, which identifies tasks essential to the overall project’s completion and whether they’re on schedule. There’s also deadline tracking, showing if milestones and deadlines are being met or at risk of delay, and highlighting any delays and their impact on the overall schedule.
Workload Analysis Overview
Here is where resources are assessed, managed and allocated. It gives insights into how workers are distributed across the project, including labor allocation to see any potential labor shortages or surpluses. Resource utilization monitors the use of equipment and materials to ensure that they’re being effectively deployed. Workload balance is observed to ensure that tasks are appropriately divided and that no part of the project is over- or under-resourced. Productivity metrics track worker efficiency and productivity, potentially comparing it to industry standards or past projects.
Construction Project Dashboard Template for Excel
The best way to understand a construction dashboard is to use one. While project management software has better dashboards that update in real time, those who aren’t ready to upgrade can download this free construction dashboard template for Excel.
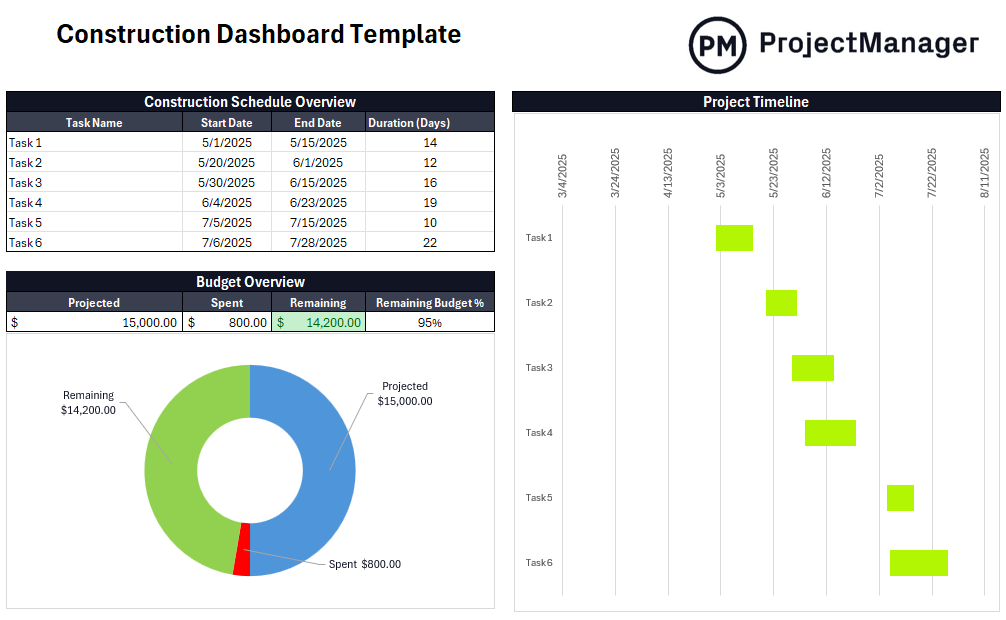
While not as robust as dashboard software, this free template gives users a chance to get a status report on construction projects. There are three charts, one providing an overview of the construction schedule, another the budget, comparing spent against project costs and a project timeline.
Benefits of Using a Construction Project Dashboard
Using a construction dashboard offers a variety of benefits that can significantly improve how a project is managed and executed. Here are some key advantages.
- Real-time insights when using software
- Improved decision-making by highlighting critical metrics and potential issues
- Better communication by sharing dashboards with stakeholders, teams, clients, contractors and subcontractors
- Enhanced project control by effectively allocating resources, managing timelines and keeping the project within budget
- Increased accountability through a transparent overview of who’s responsible for what and their performance metrics
- Risk identification and mitigation so project managers can take proactive steps to reduce and remove risks, which avoids the likelihood of costly setbacks
- Streamlined reporting saves time and effort by allowing stakeholders to access up-to-date reports at any time
- Cost savings by preventing cost overruns by managing resources more effectively.
- Improved team collaboration by sharing the same data and eliminating the need for multiple status updates
- Enhanced client satisfaction through sharing project progress improves trust
Get your free
Construction Dashboard Template
Use this free Construction Dashboard Template for Excel to manage your projects better.
How to Make a Construction Project Dashboard With ProjectManager
We’ve been discussing how project management software is superior to using construction dashboard templates. While we offer a free template to try it and see how it works, we’ve not provided a way to use dashboard software. For anyone interested in giving real-time dashboards a try, simply take a free 30-day trial of ProjectManager, no credit card required, and follow these steps.
1. Open the Gantt Chart View
Once in the software, users can create a project, including its budget. There are then multiple project views to choose from, such as kanban boards, task lists and a calendar view. Choose the Gantt chart. This is where the project schedule is created.
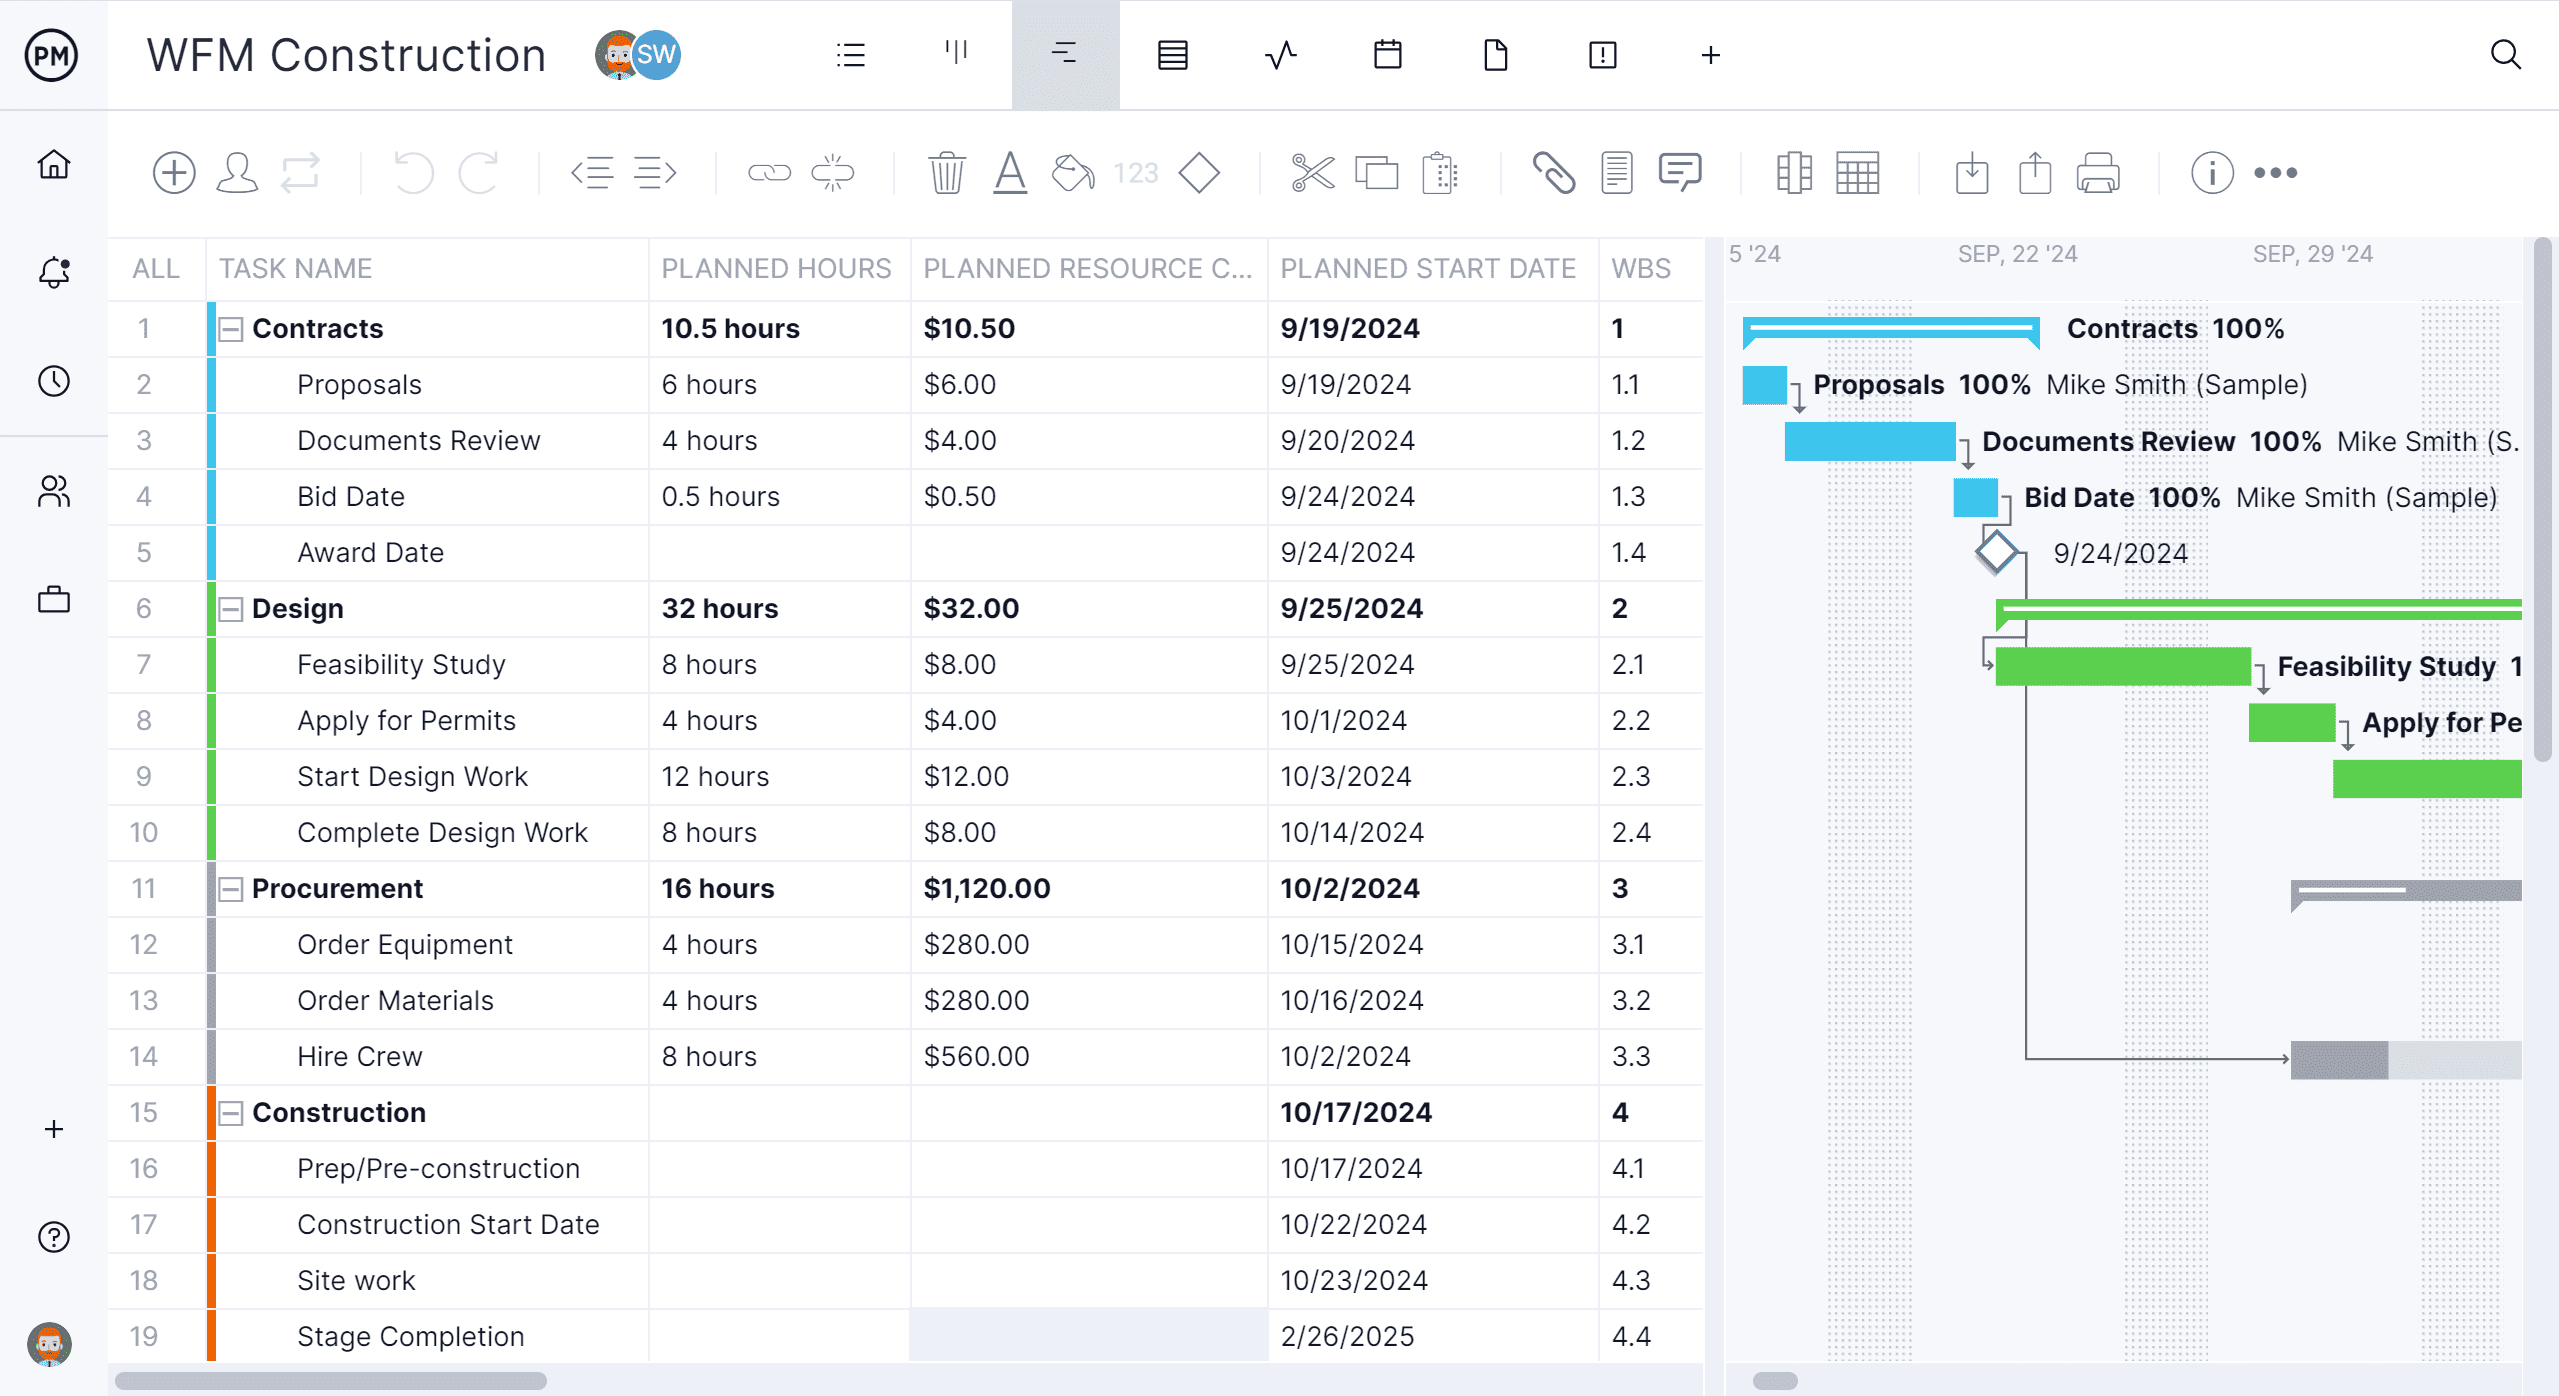
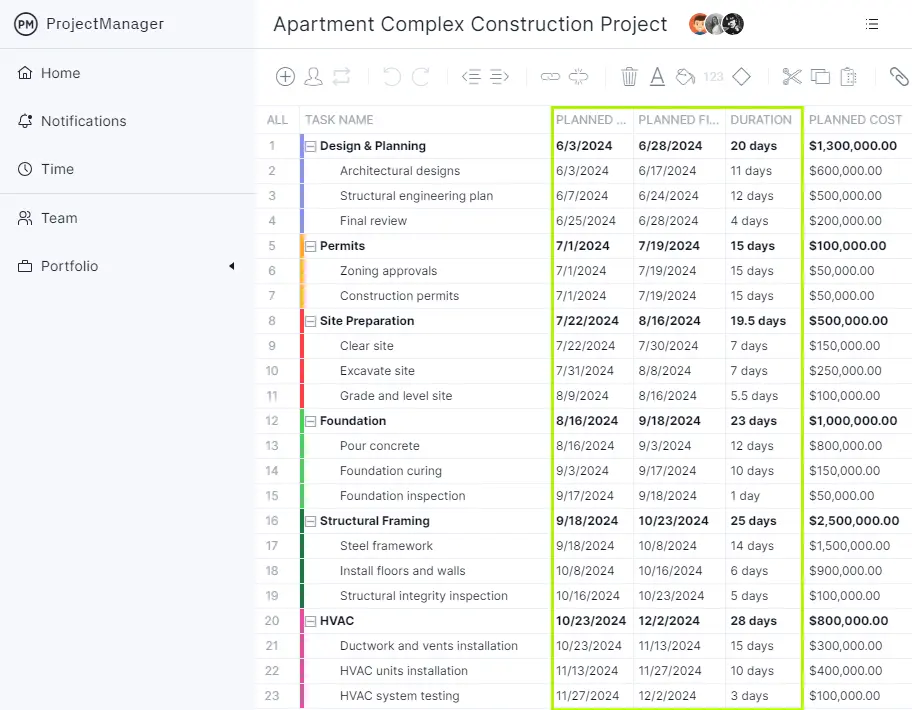
2. List Tasks and Enter their Planned Due Dates
In the Gantt chart, which is divided between a spreadsheet on the left and a timeline on the right, start to add all the project tasks. Users can add these tasks directly into the Gantt chart or import an existing task list from an Excel spreadsheet, CSV or Microsoft Project file. Once the tasks are listed, add the planned due dates for each.
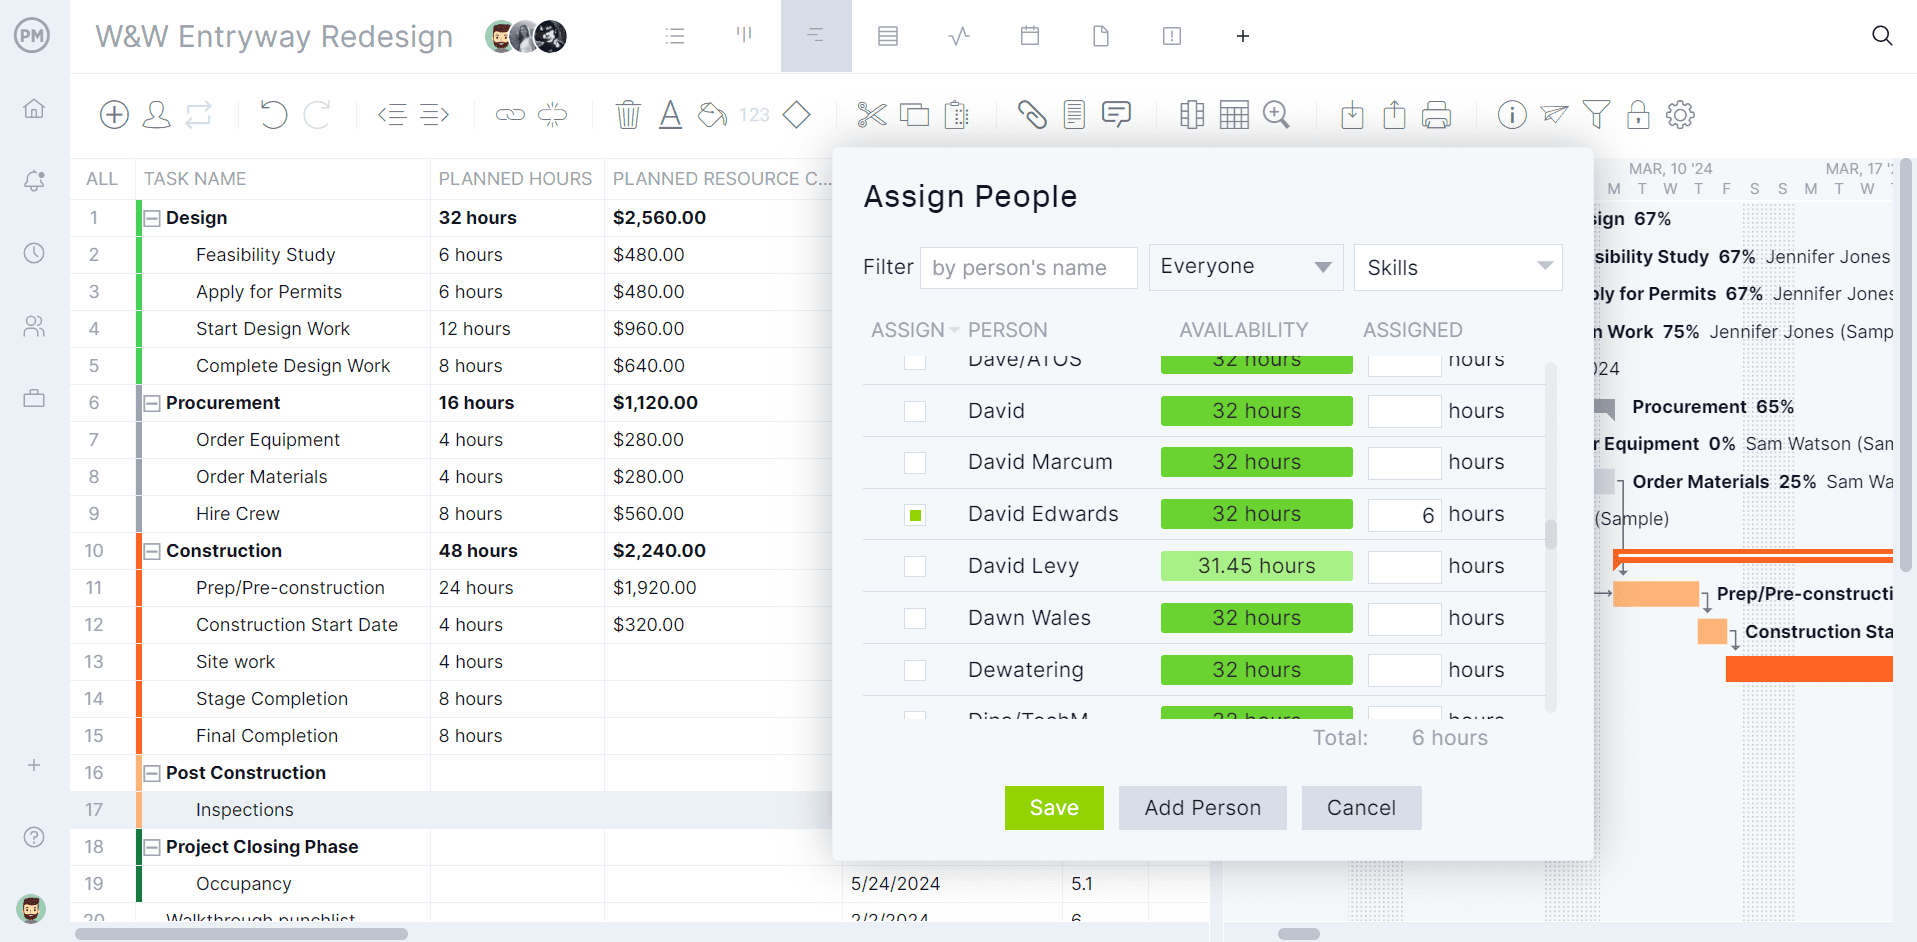
3. Assign Tasks to Team Members
Next, onboard the team. At this point, the project manager can add their availability, such as PTO, vacation and global holidays, including skill sets, which makes it easier to know who can do what and when. The project manager can also establish the hourly pay rate for each team member.
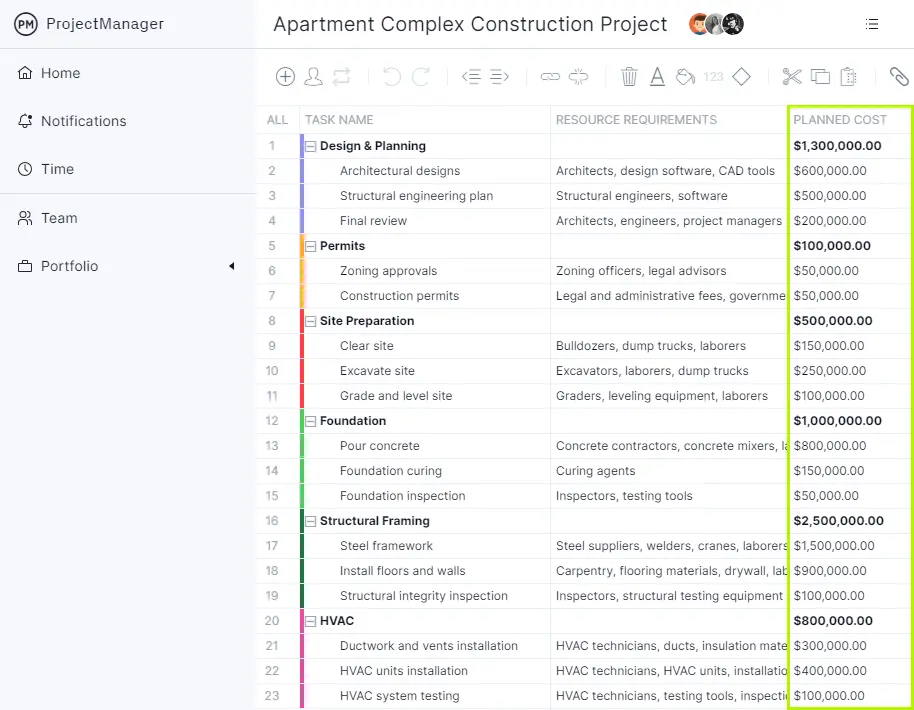
4. Estimate the Cost of Each Task
This is done by adding the labor costs to any nonhuman resources needed for each task. By doing this, project managers will not only be able to compare planned costs against actual costs but more accurately estimate the budget for the project.
5. Enter the Actual Start and End Dates of Tasks
Now, again on the Gantt chart, add the actual start date for each task listed. Also, add the end dates for those tasks. This information will be used by the construction project dashboard to calculate costs as the project is being executed.
6. Enter the Actual Cost of Tasks
As team members update their status, enter the actual cost of the project. This will allow the software to calculate the variance in the budget and help capture cost overruns quickly, which allows project managers to reallocate resources as needed to get back on track.
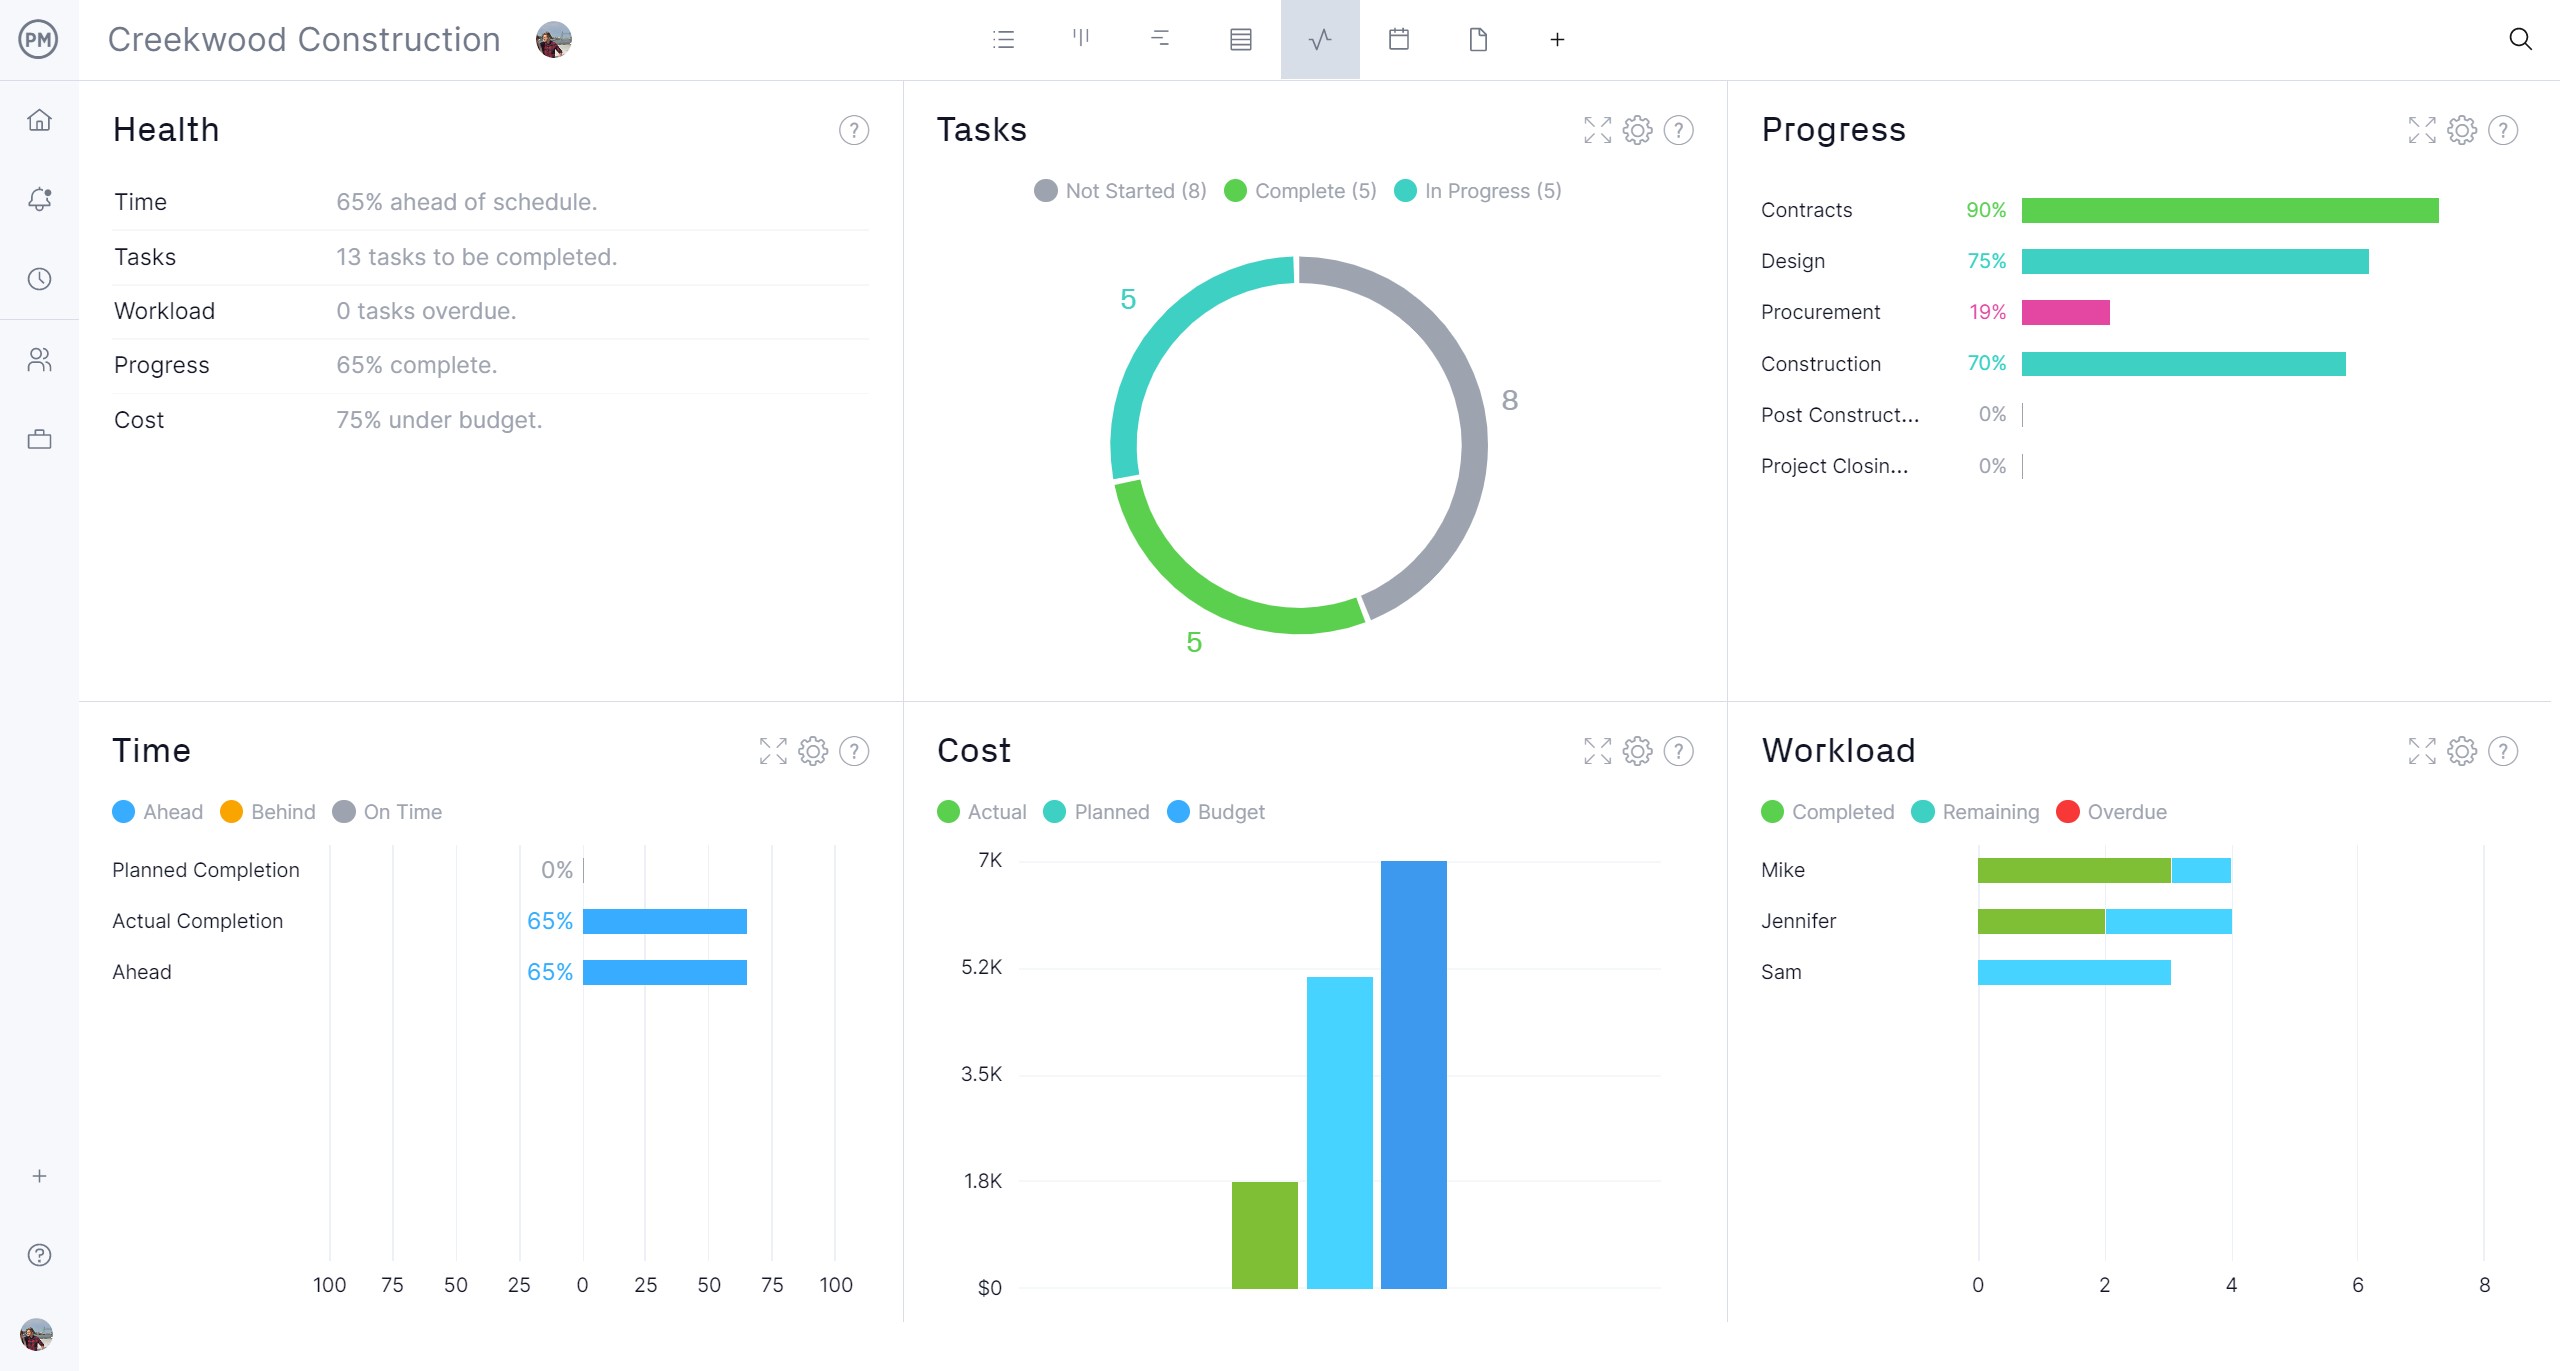
7. Monitor Your Project With ProjectManager’s Real-Time Construction Dashboard
Once a baseline is set on the Gantt chart, it will capture the schedule, budget and resource plans and be able to automatically compare that plan against what’s currently happening in the project. Users can then toggle over to the real-time construction dashboard where the data is displayed in easy-to-read graphs and charts that show time, cost, workload and more.
Why Use ProjectManager to Make a Construction Project Dashboard?
Using ProjectManager’s dashboard is certainly better than a construction project dashboard template, but it also beats most dashboard software on the market. It’s robust and user-friendly with a comprehensive overview, real-time data and customizable views. This intuitive and visual construction project dashboard also integrates with time and resource tracking, task management and multiple project views. This helps forecast and analyze data. It’s mobile-friendly with an Android and iOS app and integrates with other tools, such as Microsoft Office, Google Drive and others.
Balance Team Workload and Monitor Performance
Monitoring progress and performance is important but, when an issue arises, project managers need the tools to adjust the project. One of those many tools in our software is the resource management features. Once teams have been assigned their tasks, project managers can get an overview of resource allocation by looking at the color-coded workload page.
This makes it clear to see who’s overallocated or underutilized. The team’s workload can then be balanced from the chart to keep everyone working at capacity without risking burnout. There’s also a team page for a daily or weekly summary of team activities, which can be filtered by priority, progress and more to monitor performance.

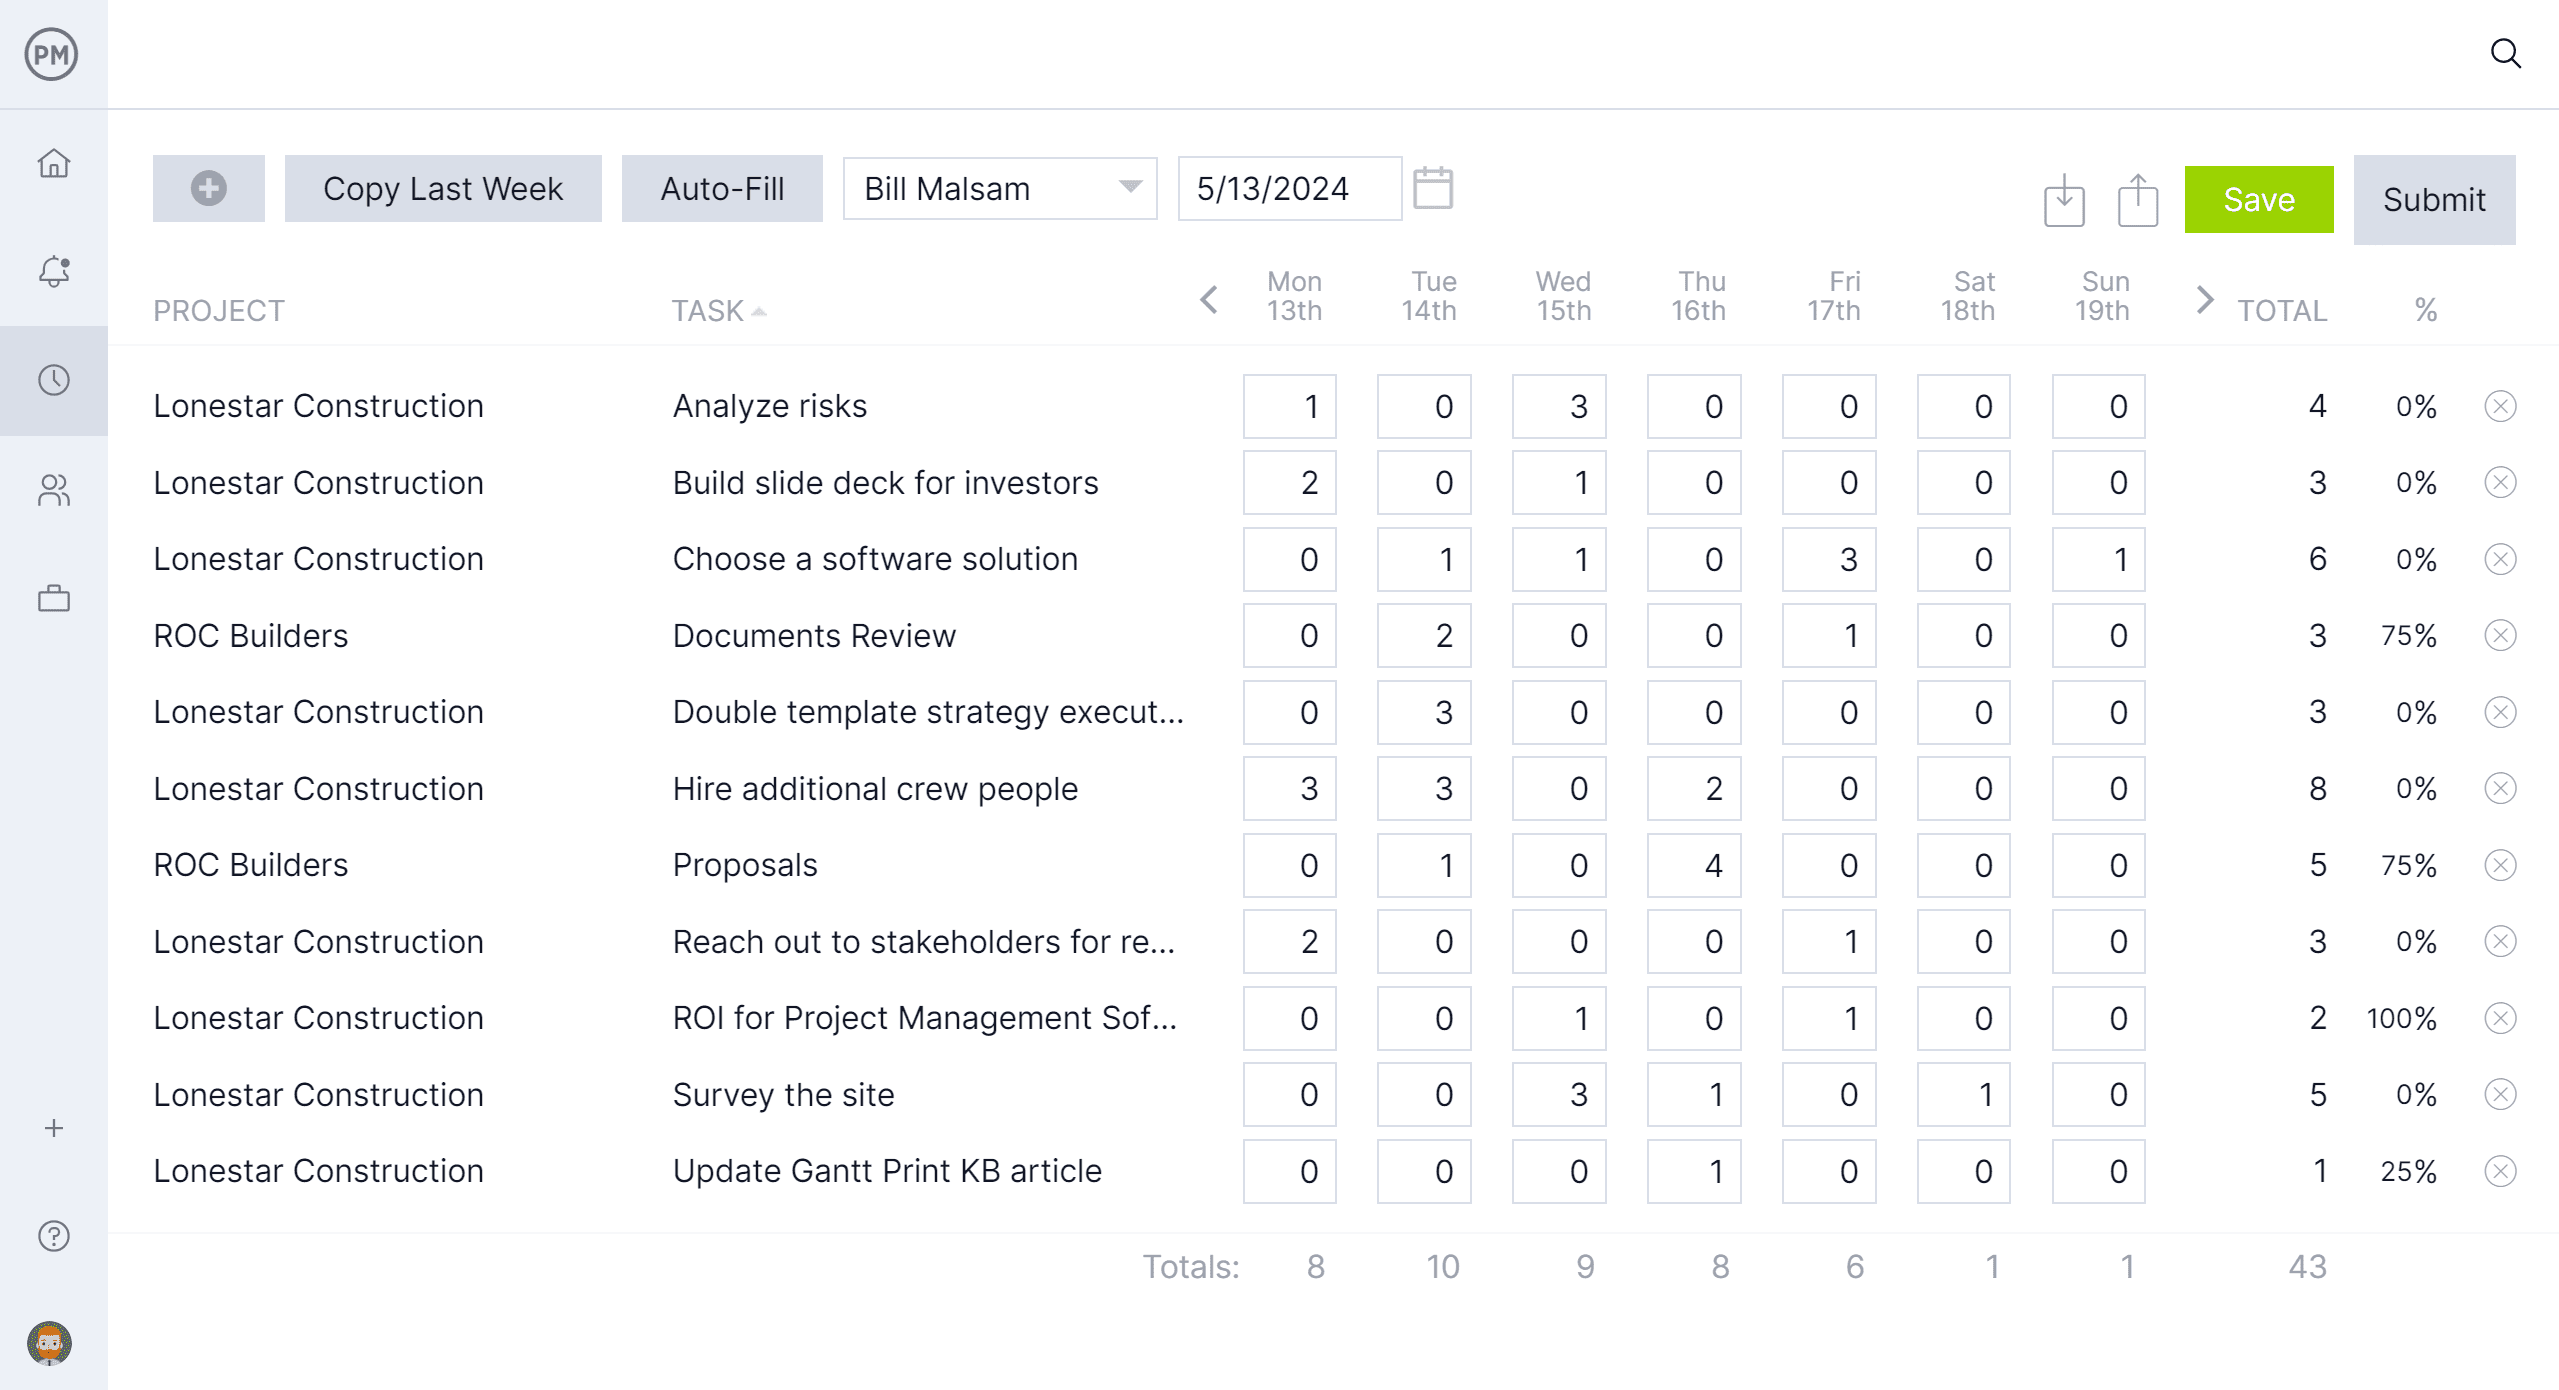
Control Labor Costs with Online Timesheets
Another tool that can monitor labor costs and help to keep projects on budget is our timesheets. These secure timesheets can automatically log hours onto the Gantt chart, task lists and kanban boards. It’s easy to add hours worked to a timesheet, the team members need only select their tasks and use the built-in project time management tools. Project managers can track the hours team members are spending on their tasks and how much it’s costing. They receive a notification when timesheets are read, and only those authorized can open and approve the timesheets.
Related Construction Project Management Content
A construction project dashboard is an important tool in construction project management, but it’s only a small part of the larger whole. For those curious about learning more about construction documentation, scheduling software, Gantt charts and more, click on the links below to read our recent posts on these topics.
- 32 Construction Documents (Templates Included)
- Free Excel Construction Templates
- Best Construction Scheduling Software
- Construction Cost Management
- Why Use a Gantt Chart in Construction Project Management
ProjectManager is online project and portfolio management software that connects teams whether they’re in the office or on the job site. They can share files, comment at the task level and stay updated with email and in-app notifications. Get started with ProjectManager today for free.
