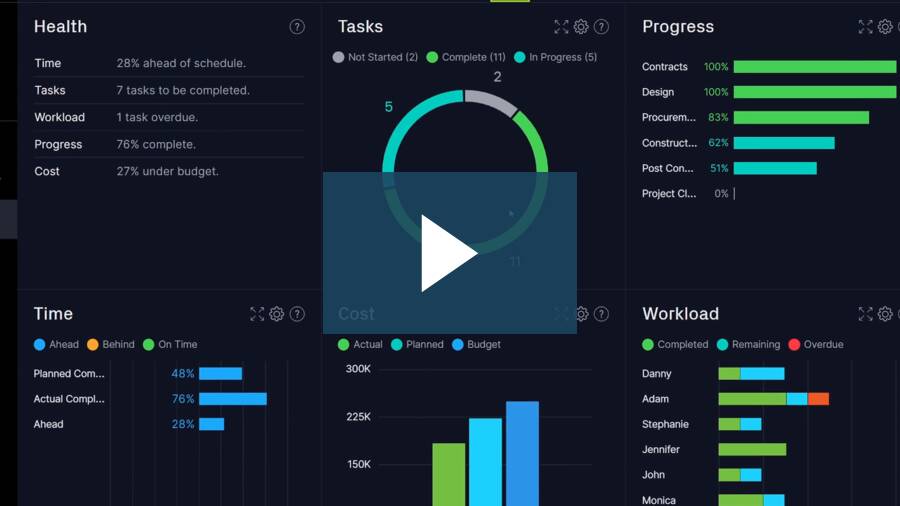
Monitor project progress with our free project management dashboard template. Track task status, budget and your project progress. A dashboard is an essential project management software tool that provides you with an at-a-glance overview of your project. Download your Excel project dashboard today and take the first step to good project tracking!
Or, if you want to take your project tracking even further, open up the free project dashboard in ProjectManager instead. With no setup required, our dashboard template tracks your tasks, summary tasks, time, costs, workload and overall health of your project.
Plus, ProjectManager offers more than just a dashboard. Your team can work in five different views—Gantt chart, kanban board, task list, spreadsheet and calendar—and all the live data feeds into the dashboard, updating automatically. Get started with ProjectManager for free.

Why You Need a Project Dashboard Template
The project management dashboard is your eyes into the overall workings of the project. It provides an at-a-glance view of the KPI, or Key Performance Indicators, of the project. Think of it as a progress report at the tip of your fingers.
The dashboard offers views of cost, budget, time, health, workload, progress, risk, issues and changes, plus so much more, in the project. All those areas are collected on one page, and that page is populated by graphs that record the data visually for a project manager to easier digest and get a snapshot of where they are in the lifecycle of the work.
A project manager needs a bird’s-eye view of the project, and the project dashboard offers the ideal perspective, which gives a leader all the pertinent information needed to make the right decisions. The free project management dashboard is a perfect document for collecting all the various aspects of a project so that you can have this necessary insight into its progress.
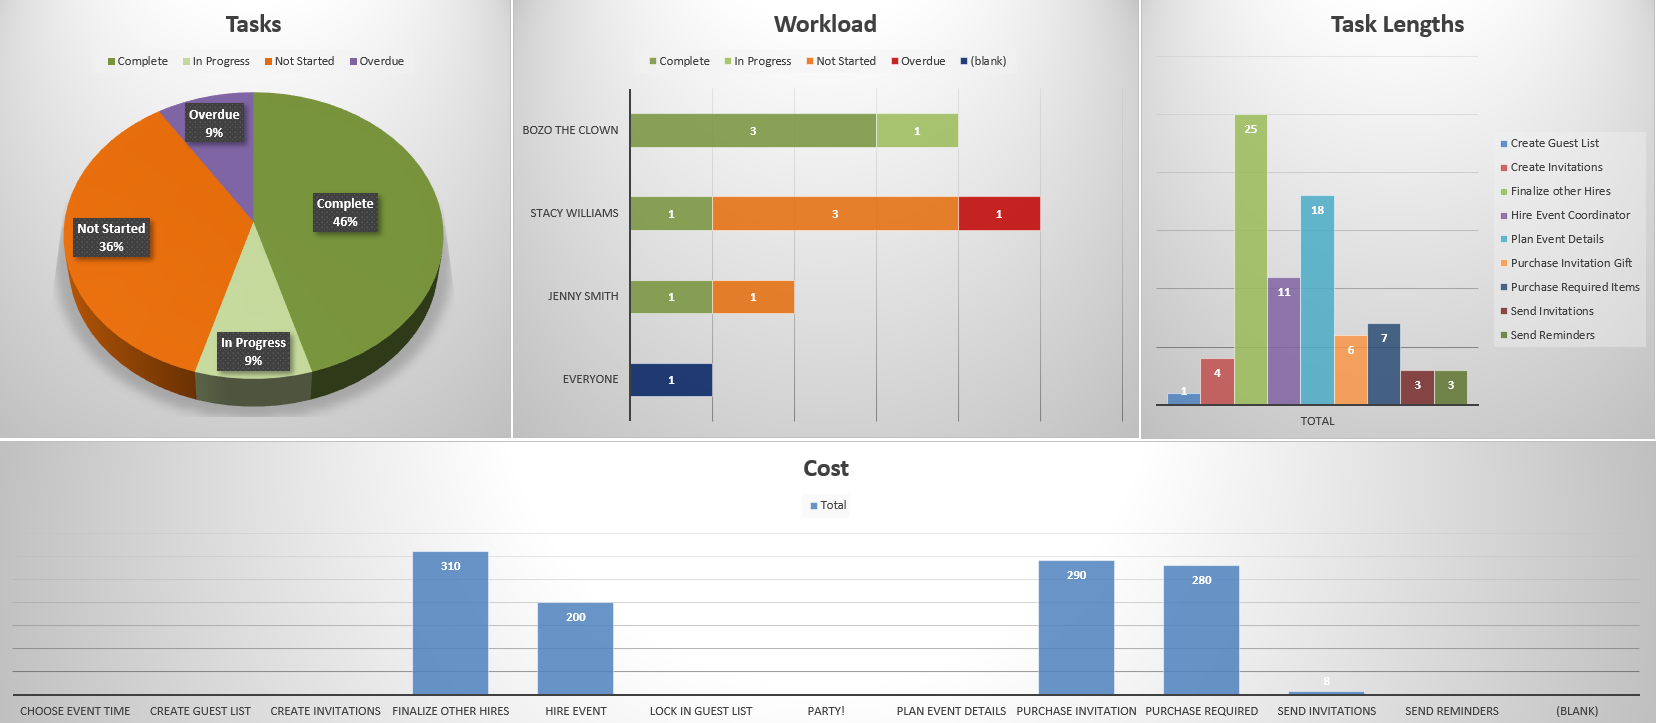
The project management dashboard can also be used to create specific requests. Focus on one of the many sections of the project and generate a graph from the dashboard for a visually compelling presentation. Hard numbers are fine, but if you’re trying to communicate, it’s best to have an engaging story, and a presentation with visual aids such as the graphs made by your dashboard is more likely to get the point you want across clearly and quickly.
How to Use Our Project Dashboard Template
Once you’ve downloaded your project dashboard template, it’s time to get the project information into it so you can now profit from all the potential benefits of the tool.
1. Tasks
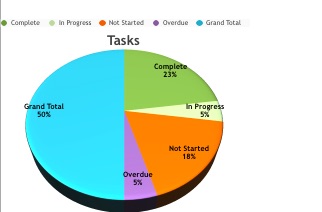
Your project is made up of tasks. Here is where you want to list them, all of them. Once that data has been inputted into the template, you’ll be able to color-code it to represent whether that task is complete, in progress, not started or overdue. The pie chart will also show you what the grand total is, and note the percentages, for those of you who prefer a hard figure.
2. Workload
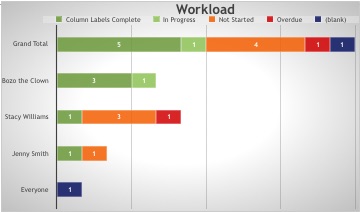
Next, you’ll need to address the workload. This bar chart is composed of every team member, with a line item for the group as a whole. Their progress is color-coded to include if the work is complete, in progress, not started or overdue. You can of course customize the coding to match your project and the workload you need tracked.
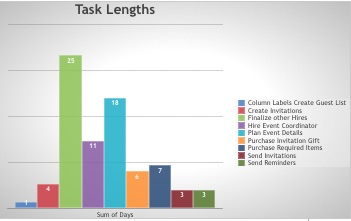
3. Task Lengths
Having a task list and incorporating it into the tasks chart in your dashboard is a good start, but adding another graph to note the duration of the tasks will help to point out what is taking too long and requires more resources to complete. Here is where that information is stored.

4. Cost
The budget is one of the most important parts of project planning, and when you’re in the midst of your project, it’s crucial to make sure those estimates you made are accurate. If you don’t have a chart like this cost one in which planned versus actual budget figures are calculated, then you don’t have a financial tether on your project and it will go cost you money and possibly the very viability of the project itself.
What This Project Dashboard Template Can & Can’t Do
Using this dashboard template is really only getting a taste of what a robust dashboard can do for your project. Think of it as a bridge to get you from Point A to Point B, or from skepticism on the need for a dashboard to sign up for our real-time dashboard software.
What This Dashboard Template Can Do
Since the dashboard template has been created in Excel, it can track your project that is placed in that spreadsheet. You can create charts that can be shared with stakeholders. These charts offer a high-level view of your project, which is always useful.
What This Dashboard Template Can’t Do
The biggest issue is that this template doesn’t automatically update. That means you have to put in the time and effort to gather the data, input it and do the calculations to get the reward of the easy-to-read graphs and charts.
Another thing, you have to make copies or print out the dashboard for stakeholder presentations, rather than simply giving them access online. Finally, the dashboard is like an island. It’s not tied into your planning tools, like the Gantt chart, which means it’s not as helpful as it could be. It’s more like a progress report.
How to Import a Project Management Dashboard Template
The free project management dashboard is a great tool, for all the reasons stated, but it can be so much more when part of a robust project management software like ProjectManager. Then how do you import this document?
ProjectManager has been designed to convert these static documents into its system and in so doing give you an interactive and collaborative platform that gives you more control and insight into the project.
Begin on the ProjectManager homepage and click on the “+” menu on the upper right-hand corner of the page. Then scroll down to the import selection, hover over it and another window will pop up. Chose what you want to import.

Once the Excel documents or Microsoft Project has been imported as a new project in ProjectManager, your data will populate the dashboard in our software. It’s as easy as that!
Related: How to Run MS Project on your Mac step by step!
How to Use a Project Management Dashboard in ProjectManager
Once your data is in ProjectManager you will be able to do more than merely use a formula to add up column amounts. For one thing, you’ll not have to take the time and effort to manually create reports. Just filter the information to customize the dashboard chart you want, and then, with a click of a button, it’s shared as an email attachment or across your team and/or stakeholders in a variety of formats.
Another advantage of ProjectManager’s dashboards is that they calculate the data in real-time. That’s because your team is using the cloud-based platform to input their tasks as soon as they complete them, updating their timesheets, which automatically brings the dashboard up-to-date as well.
When you use a dashboard in ProjectManager, your data is always up-to-date. You don’t need to waste valuable time creating a report for a presentation. It offers a more visually engaging presentation and creates a clear and immediate summary of the data you’re presenting. It merges utility, usability and beauty, and can be easily customized.
For more information on our real-time project dashboards, watch the video below:
What Other Templates Can Complement My Dashboard?
The project management dashboard template is only one of many free project management templates we offer on our site. Some of them are directly compatible with the dashboard and give you a more complete view of your project. Try the following to get more control and keep your project on track.
Gantt Chart Template
A Gantt chart is a visual tool that sets all your tasks on a timeline. This template thoroughly organizes all your tasks and their duration. You can color-code the phases and track your progress as you move from one project milestone to the next. This also keeps morale high, as you can reward your team once they’ve completed a project phase.
Risk Tracking Template
One way to better use the dashboard is to know what you’re looking for. A risk management plan is part of any project, and the risk tracking template is a way to deal with those risks if and when they arise in the project. You can use this template to collect risks that show up in your project, assign a team member to them and then track their progress in resolving the problem.
Status Report Template
Status reports are a means of communicating where the project is. They’re a key tool of project managers and required reading for stakeholders to keep them updated. The status report template can be delivered weekly or bi-monthly, depending on how active the project is, and this template streamlines the delivery of those reports by having much of the work already done.
Related Content
There’s so much more you can do with a dashboard. ProjectManager has a blog that posts articles and videos regularly on our site. It’s a hub for project management professionals and novices alike to gather and learn more about the fundamentals and more arcane aspects of the work. We’ve written extensively about dashboards and tracking, and here are a few of the more recent and relevant posts.
Try ProjectManager Free for 30 Days
Thanks for downloading our free project management dashboard template, and hopefully we’ve convinced you of the benefits of using a collaborative online project management software program like ProjectManager.
If you want to see how your data becomes more accessible and drives productivity when imported into ProjectManager, then sign up for a free 30-day trial.
ProjectManager has been ranked #1 by Gartner’s GetApp repeatedly as the best project management application. These rankings are by independent users just like yourself, so why not try it yourself and tell us what you think. We believe you’ll agree that nothing manages a project better than ProjectManager.

