Project managers use many tools to plan, manage and track projects, but few tools are as powerful as a Gantt diagram. However, Gantt diagrams are often thought of as difficult to create. We’ll show you how to build one from scratch or download free templates to get started.
Learn the components of a Gantt chart and see how to use one in a real-life scenario to better illustrate its worth. Then see the difference between a Gantt diagram in Excel and a Gantt diagram online to determine which is the best platform to manage projects.
What Is a Gantt Diagram?
A Gantt diagram is a visual project management tool that illustrates a project schedule. It shows all the tasks of a project on a timeline. Each task is represented by a task bar with a start and end date. On the left side, all of the tasks, duration and more are listed on the spreadsheet, while the timeline is on the right side of the Gantt diagram.
Using a Gantt diagram gives project managers and their teams a clear visual representation of the project timeline. This allows them to understand the schedule and progress at a glance. It’s not simply a scheduling tool, though, but also a powerful task management asset. It allows project managers to assign tasks, track their progress and identify potential roadblocks that can be resolved before causing delays.
Teams also benefit from Gantt diagrams. It shows them deadlines and milestones, which are important dates in the project schedule, such as when one phase is completed and another started. This helps to keep teams focused and accountable. Managers are scheduling more than tasks, but also resource allocation and how to distribute them across tasks to manage workflows efficiently.
Of course, a Gantt diagram for Excel or even a Gantt diagram for Google Sheets won’t give users the full benefits of this valuable project management tool. Excel isn’t collaborative, and while Google Sheets are, they both have to be manually updated and are isolated from other project management tools. To get the most out of a Gantt diagram, use project management software.
ProjectManager is award-winning project and portfolio management software with Gantt charts that manage one or multiple projects in real time. Our collaborative platform allows Gantt diagrams to be shared across multiple project views, such as kanban boards, task lists and calendar views, allowing teams to execute their work with the right tool. Our Gantt diagram does more than organize tasks, add milestones and assign team members. It can filter for the critical path to identify essential tasks, link all four types of dependencies to avoid costly delays and set a baseline to track variance in real time. Get started with ProjectManager today for free.
What Should Be Included in a Gantt Diagram?
A Gantt diagram is primarily made up of two parts; a grid and a timeline. We explain these two major parts of the Gantt diagram below.
- Gantt Diagram Grid: This is a spreadsheet divided into columns and rows. The key columns are a task list, which names the task. There is then a column for the start and end dates and another that estimates the task duration. Other columns can be added to identify needed resources, both human and nonhuman, to execute the task, associated costs and even planned and actual start and end dates to help track progress.
- Gantt Diagram Timeline or Stacked Bar Chart: The other part is a timeline represented as a stacked bar chart. This translates the spreadsheet into a visual representation of the project. Tasks are shown as a task bar that is as long as the estimated duration, from the start date to the end date. Milestones are indicated on the timeline by diamond icons. Task dependencies are linked. There are four types of task dependencies: start to start, start to finish, finish to finish and finish to start.
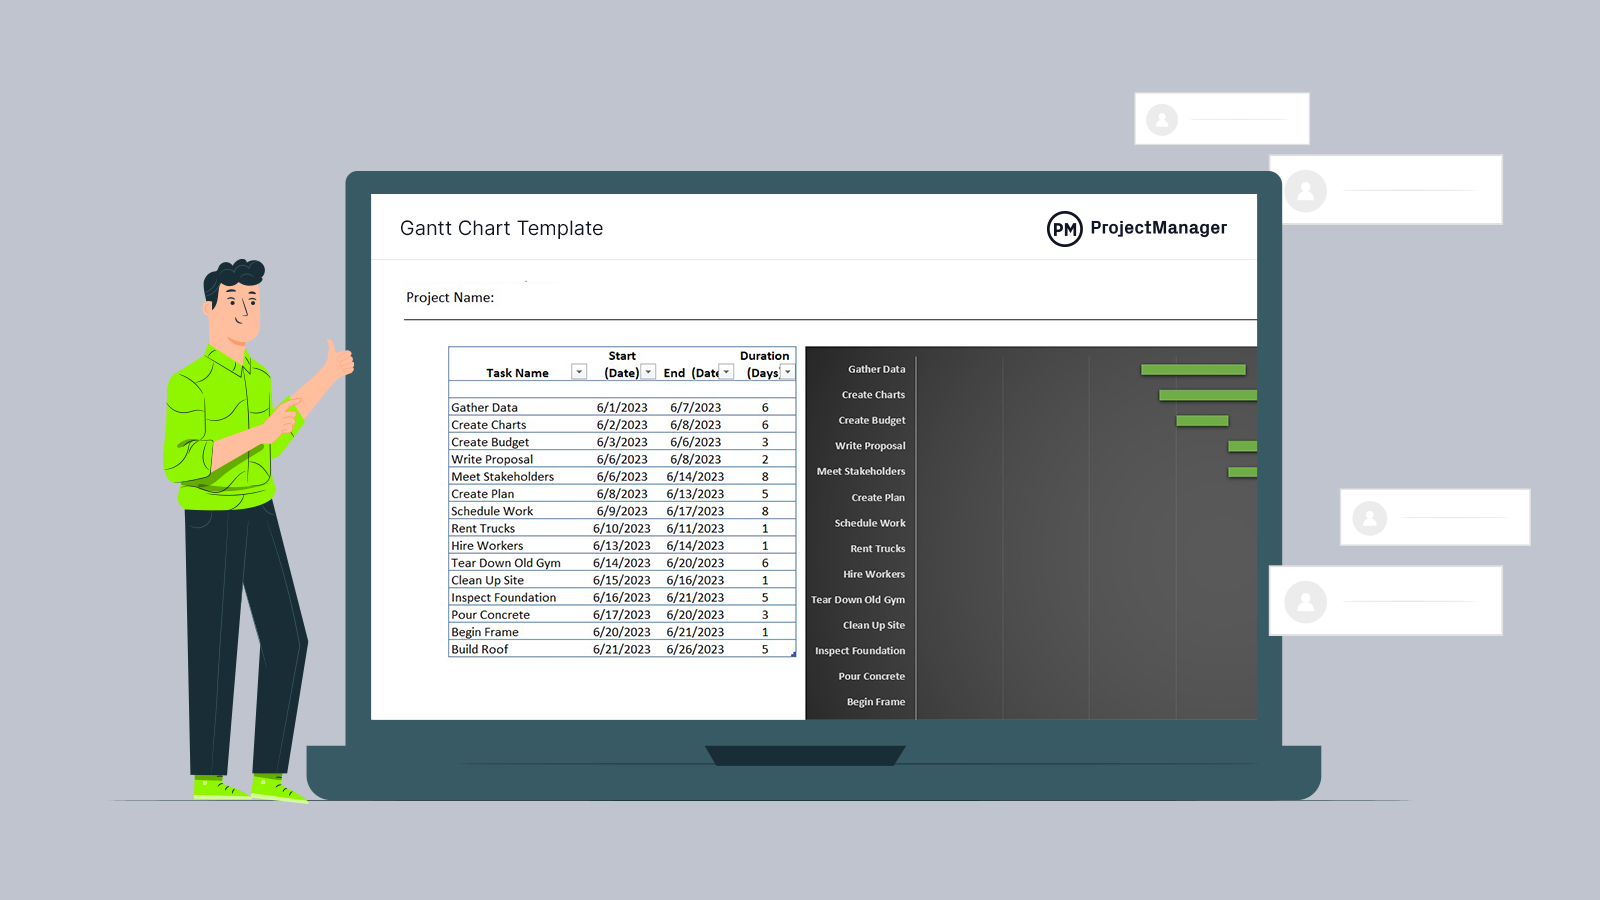
Get your free
Gantt Chart Template
Use this free Gantt Chart Template to manage your projects better.
Get the Template
How to Make a Gantt Diagram
Now that the definition and parts of a Gantt diagram are clear, it’s time to make one so it can be used in managing a project. The following are the simple steps to make any Gantt diagram, but we’re illustrating it with ProjectManager. To follow along, start by taking a free 30-day trial. There’s no commitment or credit card required.
1. List Project Tasks
The first step is to create a task list. This is a complete list of all the tasks needed to deliver the project. To identify the tasks, use a work breakdown structure (WBS), which is a hierarchical chart with the final deliverable on top of the tree diagram and the other deliverables that lead to it branching below it. Each deliverable is created by a task, which is why a WBS is so important to this step to make sure nothing falls through the cracks.
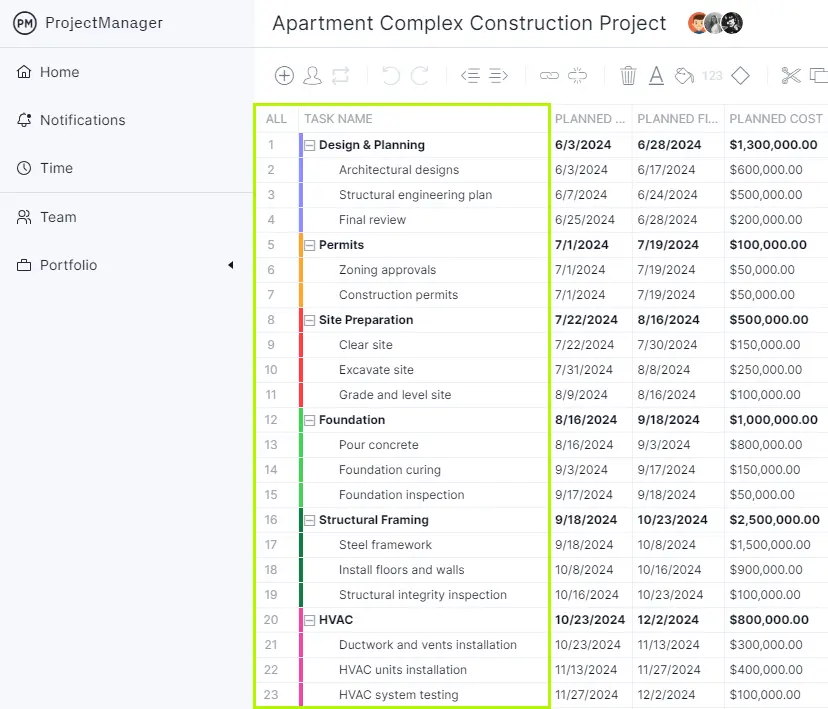
Once these tasks are compiled, add them to the task name column. This column breaks down project phases. The tasks can also be further broken down into subtasks as necessary. To differentiate these different stages, the rows of the Gantt diagram can be color-coded.
2. Estimate Task Duration and Set Due Dates
The next set is to estimate the duration of each task. There are several different techniques to make these forecasts as accurate as possible. One thing to do is research historical data from similar projects to see how long they took to complete. Seeking out experienced experts in the field is also helpful as are the team members, who all have the skills and experience to inform their answers. There are other estimation techniques, such as three-point, analogous and parametric estimation.
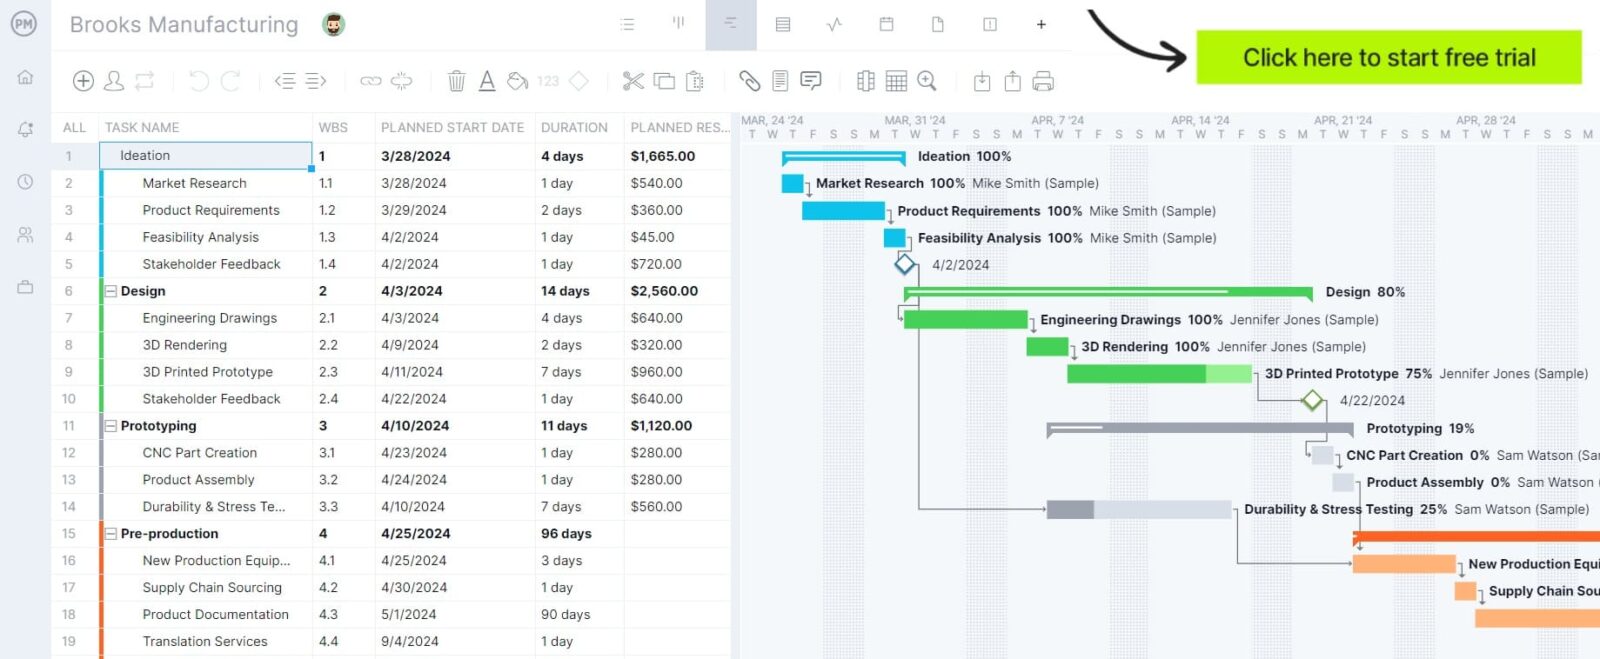
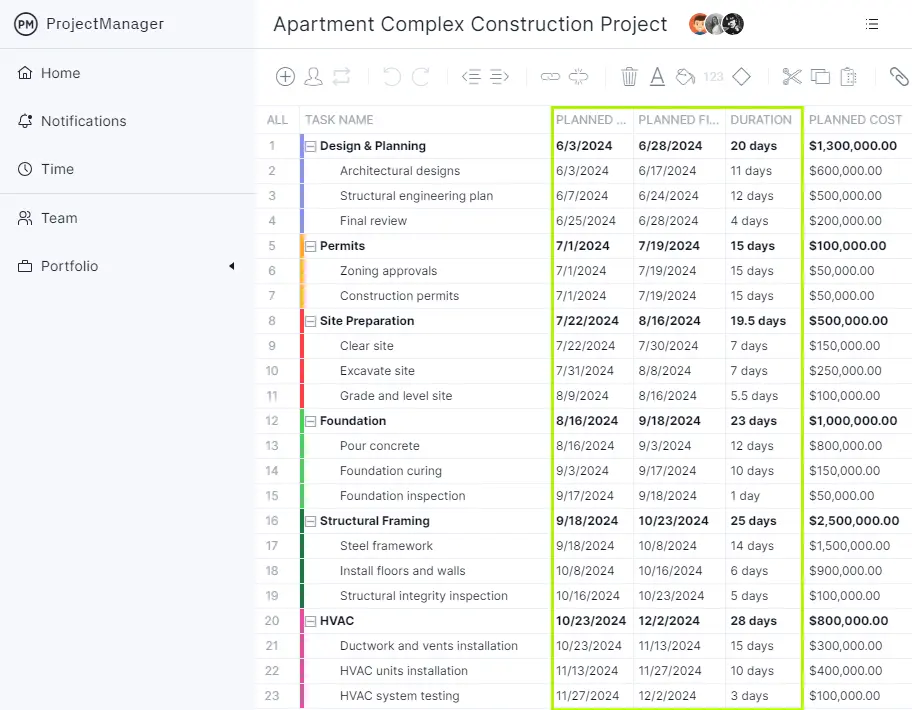
Once the duration of each task has been determined, it’s time to add them to the Gantt diagram. These are the three columns highlighted in the screenshot below. The planned start is when the task is estimated to begin. The planned finish is when the task is expected to be completed. The duration is the number of days between those two points. This information will be saved when a baseline is set and allows the user to track their planned progress against their actual progress to help manage the project to a successful completion.
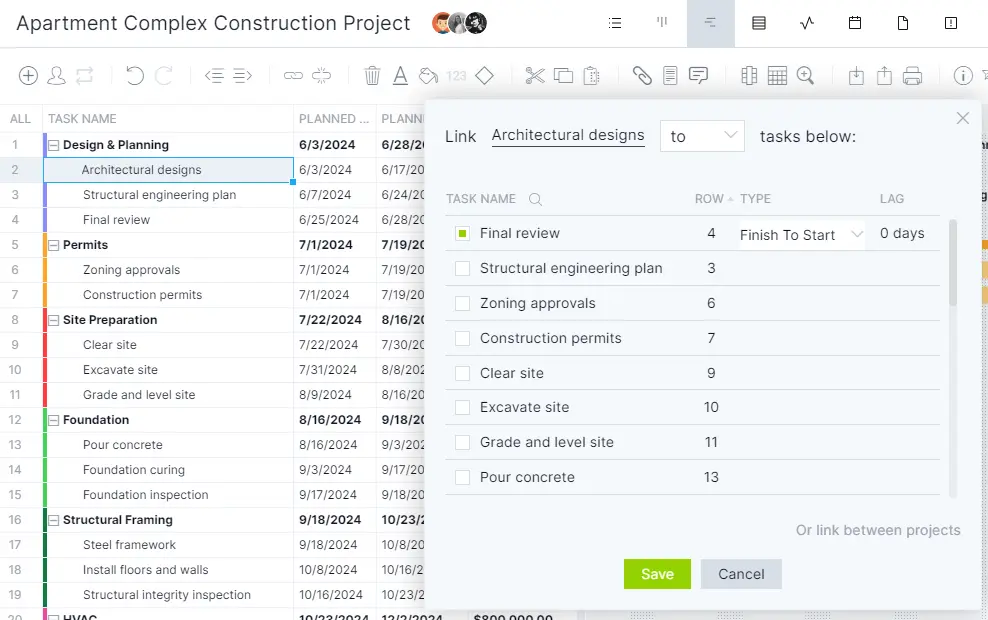
3. Link Task Dependencies
As defined above, task dependencies refer to a task that can’t be completed or started until another task has been completed or started. Not identifying these dependencies will cause delays, cost overruns and impact resource allocation, which can all lead to a late or failed project. In the image below, a popup window allows users to link the dependent tasks and define the type of dependency it is and the lag, which means the delay period between dependent tasks.
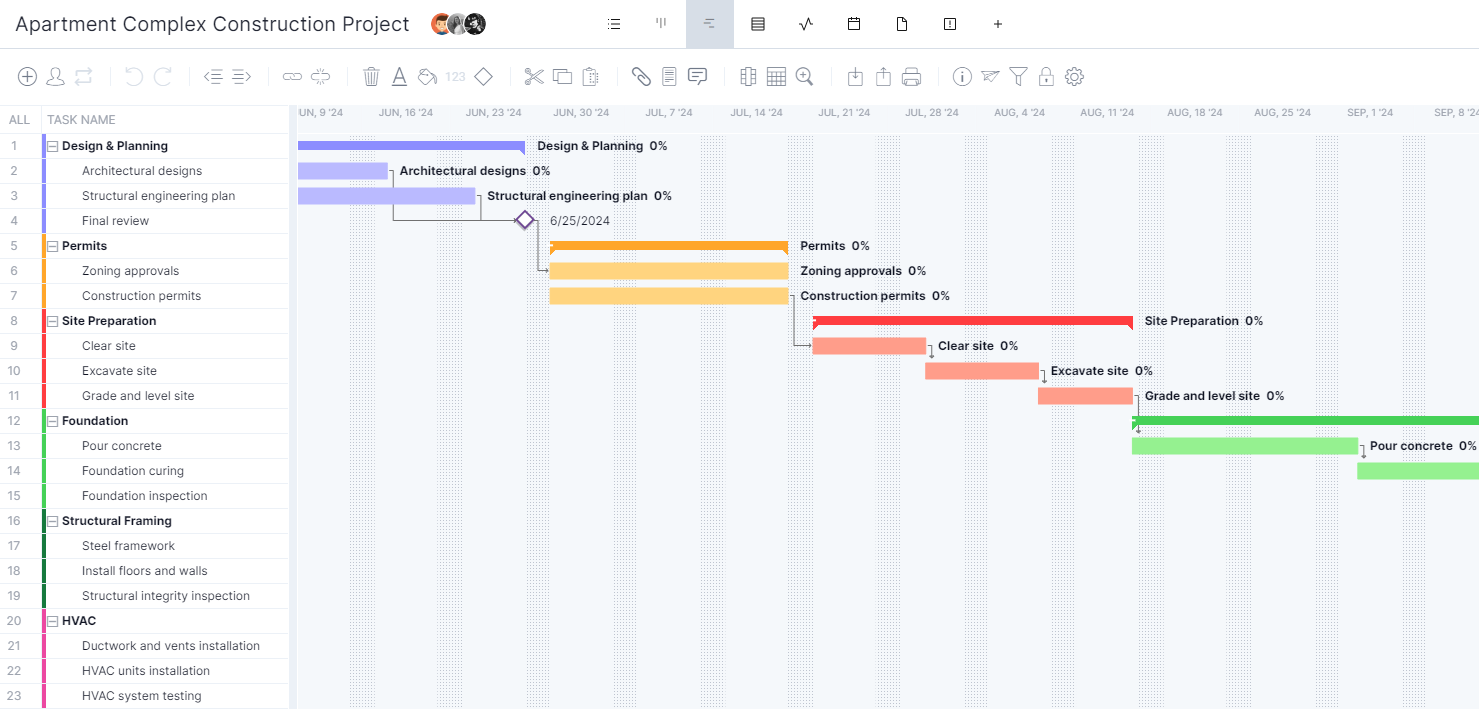
4. Make a Project Timeline Using the Bar Chart
As the spreadsheet is built up with project information, that data automatically populates the timeline to the right. The task bars are the length of the task duration, task dependencies are linked with a line and the colors for each stage also carry over. At this point, milestones (diamond icons) can also be added to identify important dates.
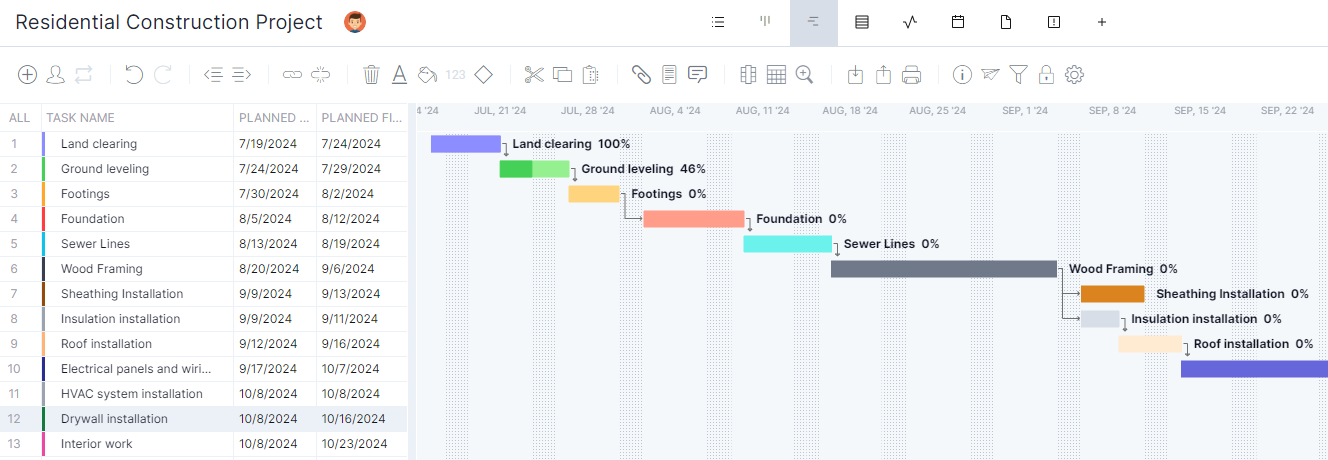
Gantt Diagram Example
To better understand how a Gantt diagram works, let’s imagine Acme Construction is building a small residential house. A basic list of tasks for this project would start with site land clearing, which has a five-day duration. This is followed by ground leveling and foundation work, which is expected to take around 10 days and is dependent on the site preparation being completed.
Next, sewer lines and framing of the building are expected to be completed in 15 days and are dependent on the foundation work being completed before it can start. Insulation and roofing come after that, with a duration of seven days. These are also dependent on the previous tasks. Once this is done, the electrical and plumbing can be installed.
The interior is then finished, which is estimated to take 12 days, depending on the roof, electrical and plumbing being done. At this point, the project site and structure are ready for the final inspection, which is estimated to take three days, depending on the task before it is completed. On day 63, if the schedule holds, the residential house will be ready to hand over to the owner.
Gantt Diagram Templates
There’s more than one way to make a Gantt diagram. For those not ready to upgrade to project management software, there are a couple of templates that can help. Our site has over 100 free project management templates for Excel, Word and more that cover all phases of managing a project across multiple industries. Here are some Gantt diagrams to download for free.
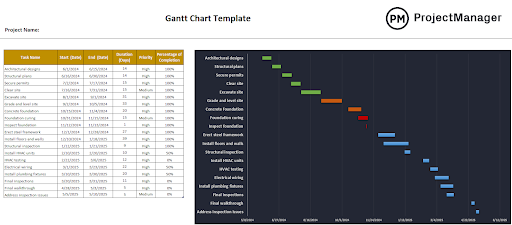
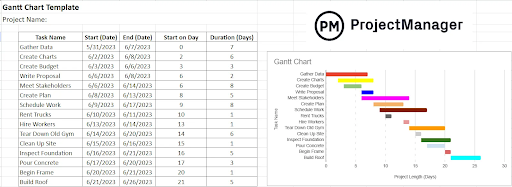
Gantt Diagram Template for Excel
This simple Gantt diagram template for Excel can easily be filled out. Once the tasks and estimated start and end dates are added, they populate a timeline automatically. There are also columns to add priority and percentage of completion to track progress.
Gantt Diagram Template for Google Sheets
A more collaborative alternative is this free Gantt diagram template for Google Sheets. It’s the same as the Excel one above it, but lives on the cloud. That means that users can share it and update the Gantt diagram, which is then updated for all users.

Why ProjectManager Is the Best Gantt Diagram Maker
Try those templates next time there’s a project to manage. They’re frustrating, right? That’s because these are static documents, but also very limited in their functionality. Gantt charts didn’t become the dominant project management tool just because they can create a timeline. Where are the task dependencies, the ability to do a fast critical path analysis or setting a baseline? These are important functions lacking in templates but available without having to make a Gantt diagram in ProjectManager.
Track Progress, Costs and More in Real Time
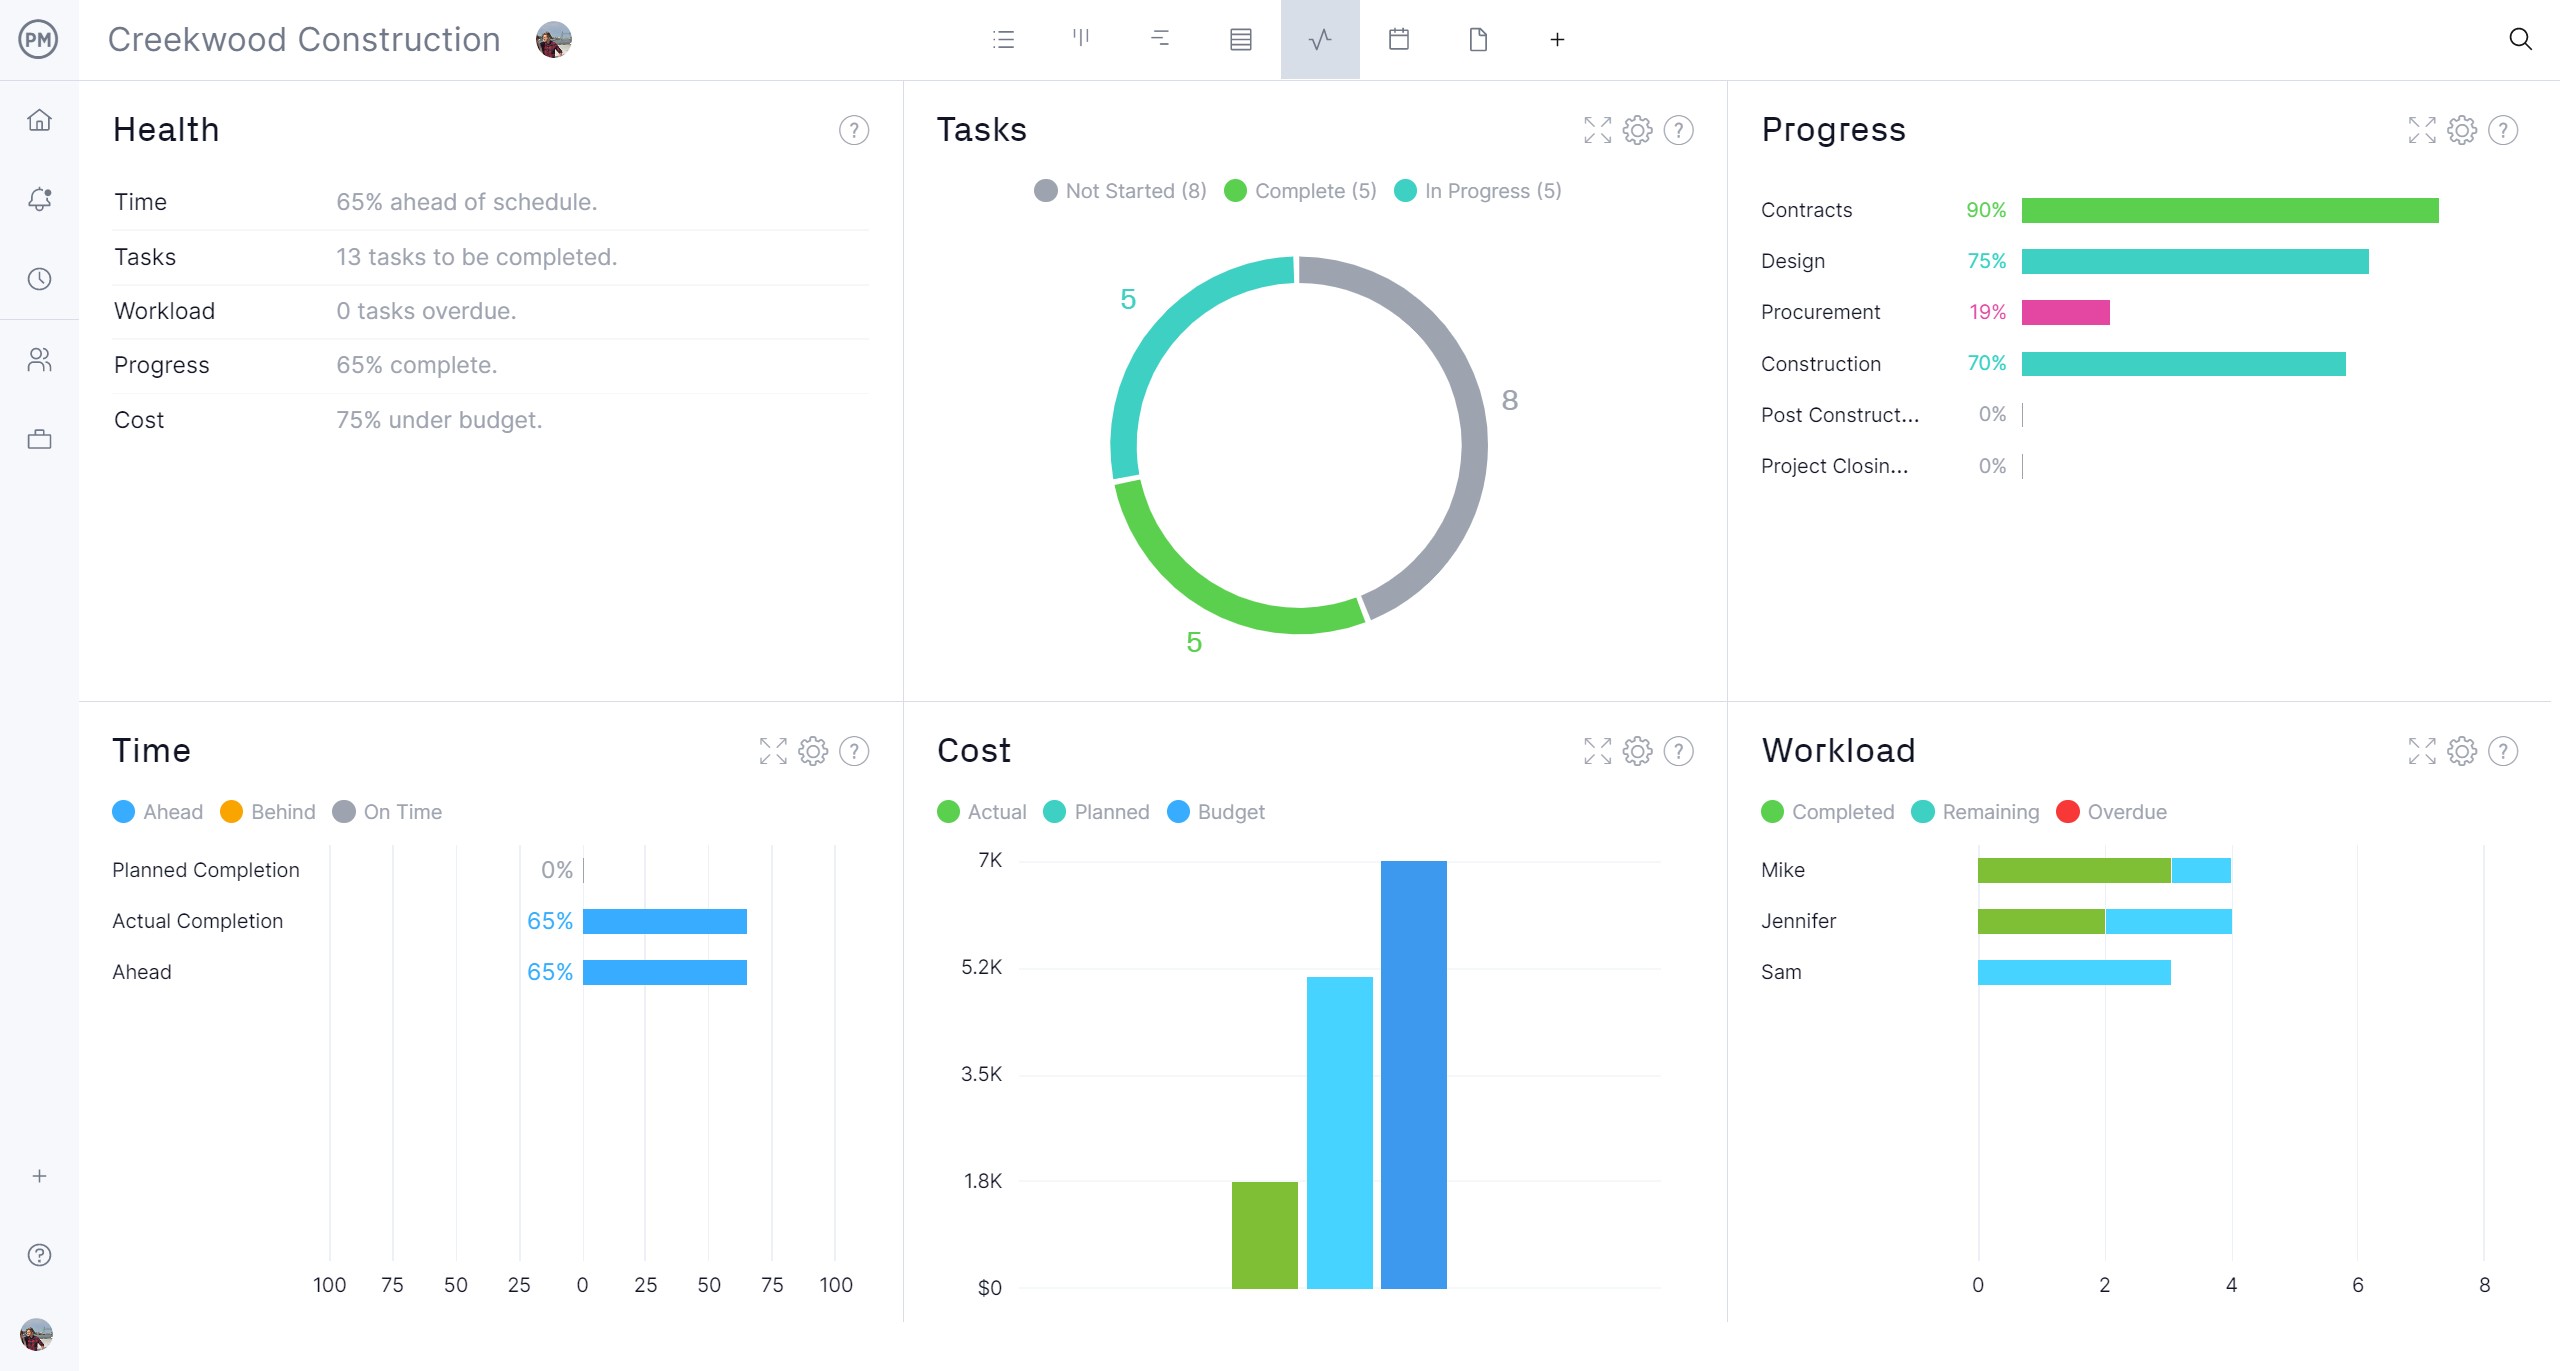
Templates might give users the illusion that they’re tracking progress by having a column devoted to status, but that’s not real monitoring. Once a baseline is set on our Gantt diagram, the software automatically takes status updates and applies them to real-time dashboards that provide a high-level overview of one or multiple projects.
View easy-to-read graphs and charts to chart key performance indicators (KPI) such as time, cost and workload in real time. Customizable reports get into the weeds for managers and their teams or filters to show more general information that can be shared to keep stakeholders informed. There are even secure timesheets that streamline payroll and provide visibility into labor costs to keep to the budget.
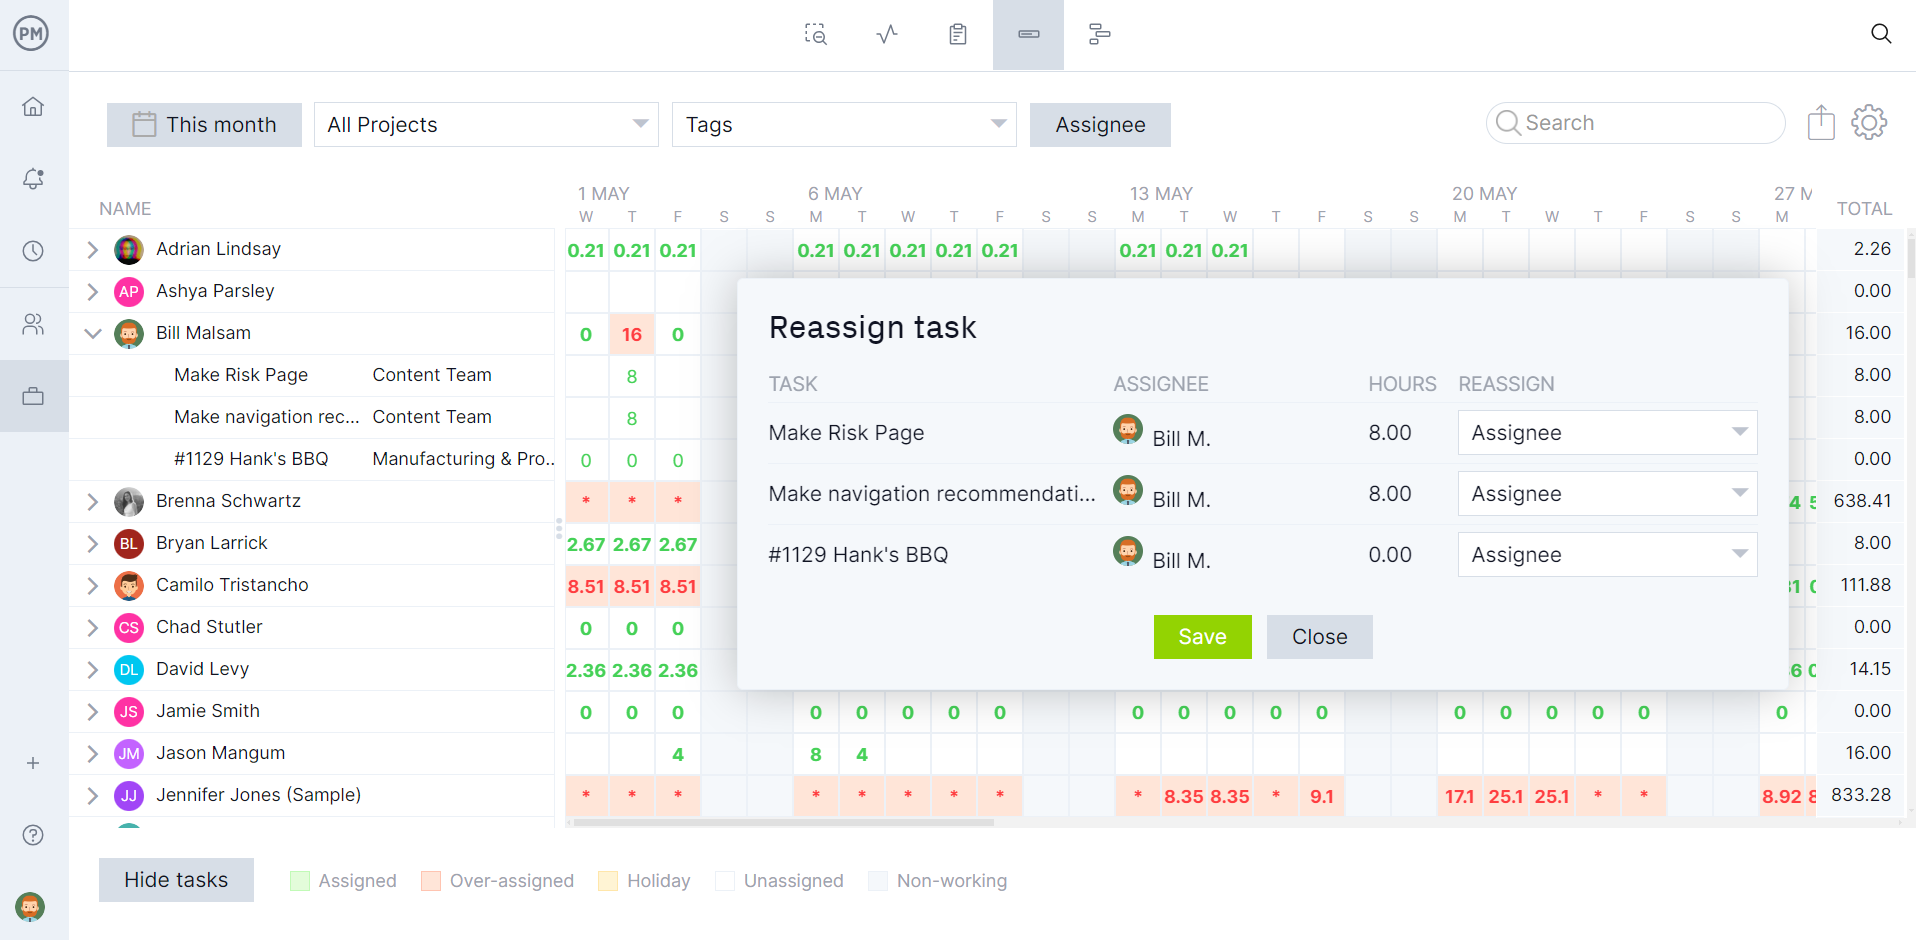
Use Robust Resource Management Features
Gantt diagrams plan, manage and track resources, too. When onboarding human resources, their skill set and availability (PTO, vacation and global holidays) can be set, which helps make assignments easier. However, if teams are overallocated it can lead to cost overruns, burnout and erode morale. If they’re underutilized, deadlines are missed and the whole project schedule is thrown out of whack. Managers can avoid this by visiting the team page or color-coded workload chart to view resource utilization and balance their team’s workload to keep them working at capacity and staying productive.
Related Gantt Chart Content
Want to learn more about Gantt diagrams, otherwise known as Gantt charts? We published a handful of blog posts about them recently. Follow the links below to find the best Gantt chart software, Gantt charts vs. PERT charts and network diagrams and much more.
- Best Gantt Chart Software (Free & Paid)
- How to Make a Gantt Chart: Steps, Tools & Tips
- A Gantt Chart Guide with Definitions & Examples
- Best Tools for Creating a Simple Gantt Chart
- Gantt Chart vs. PERT Chart vs. Network Diagram
ProjectManager is online project and portfolio management software that connects teams whether they’re in the office or out in the field. They can share files, comment at the task level and stay updated with email and in-app notifications. Join teams at Avis, Nestle and Siemens who use our software to deliver successful projects. Get started with ProjectManager today for free.
