Executing a plan, whether a project or a larger organizational strategy, is pointless without monitoring its progress and performance. Expecting everything to fall into place ignores inevitable risks and changes when abstract plans live in the real world. This is why managers use a KPI dashboard to stay on track.
A KPI dashboard, which stands for key performance indicators, is a tool to measure various metrics. There are different types of KPI dashboards but they all provide a host of benefits. Download a free KPI dashboard template to try it out and experience those benefits firsthand or upgrade to project management software instead.
What Is a KPI Dashboard?
A KPI dashboard is a visual tool that displays various metrics in graphical form to help managers track the performance and progress of projects or an organization. It’s a platform that collects various KPIs related to the project or the performance of an organization that’s used to monitor, help analyze and achieve the goals and objectives of the project or organization.
Get your free
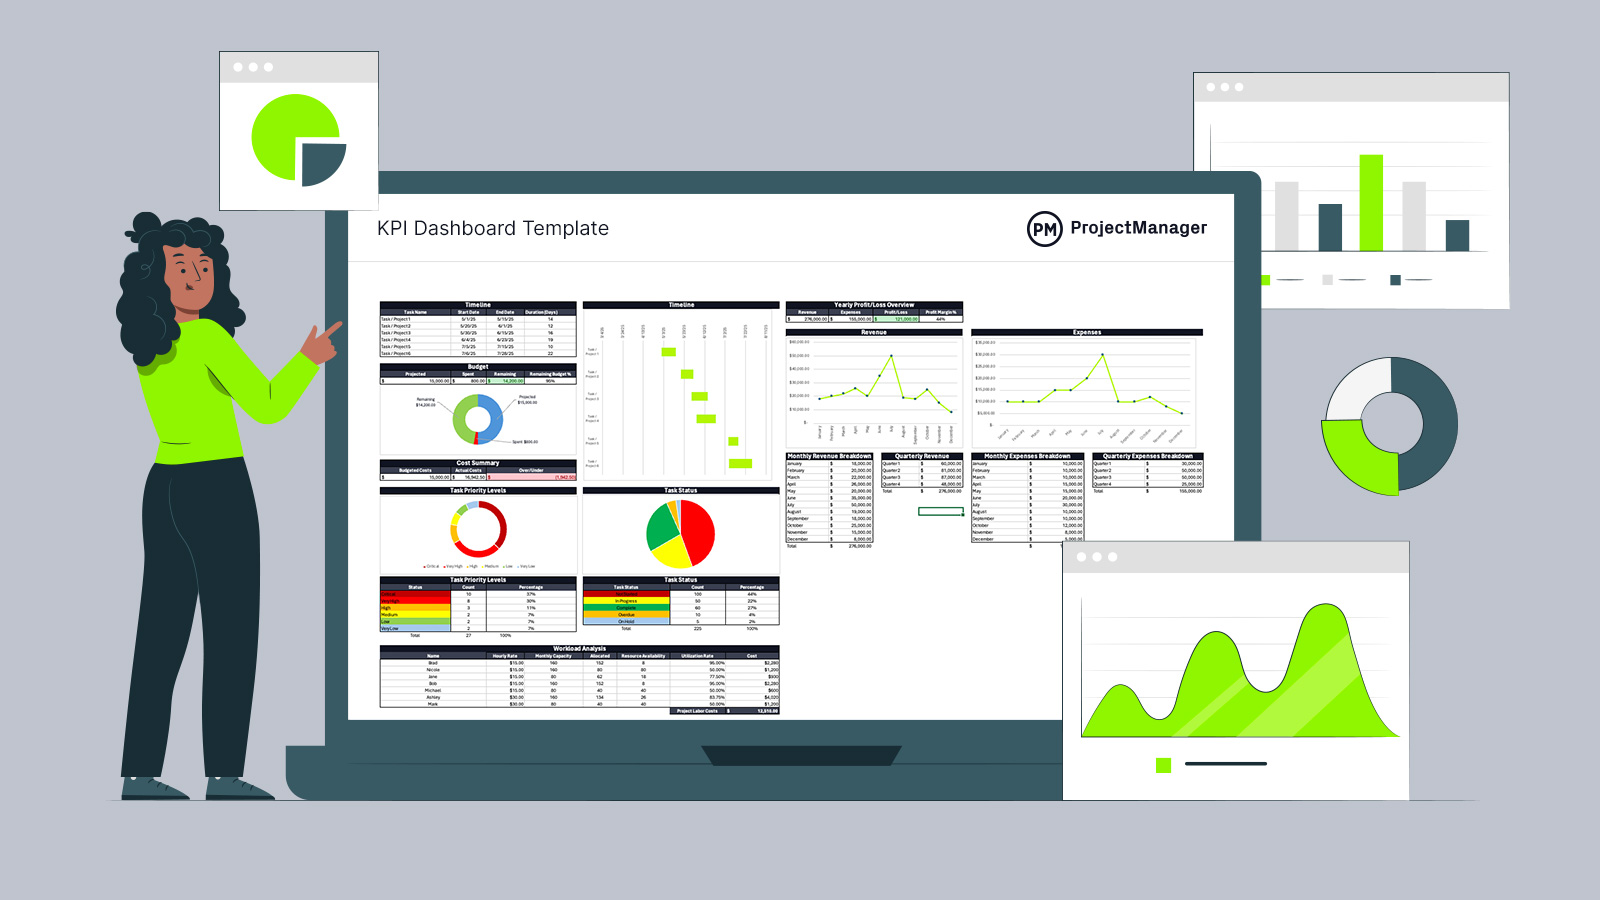
KPI Dashboard Template
Use this free KPI Dashboard Template for Excel to manage your projects better.
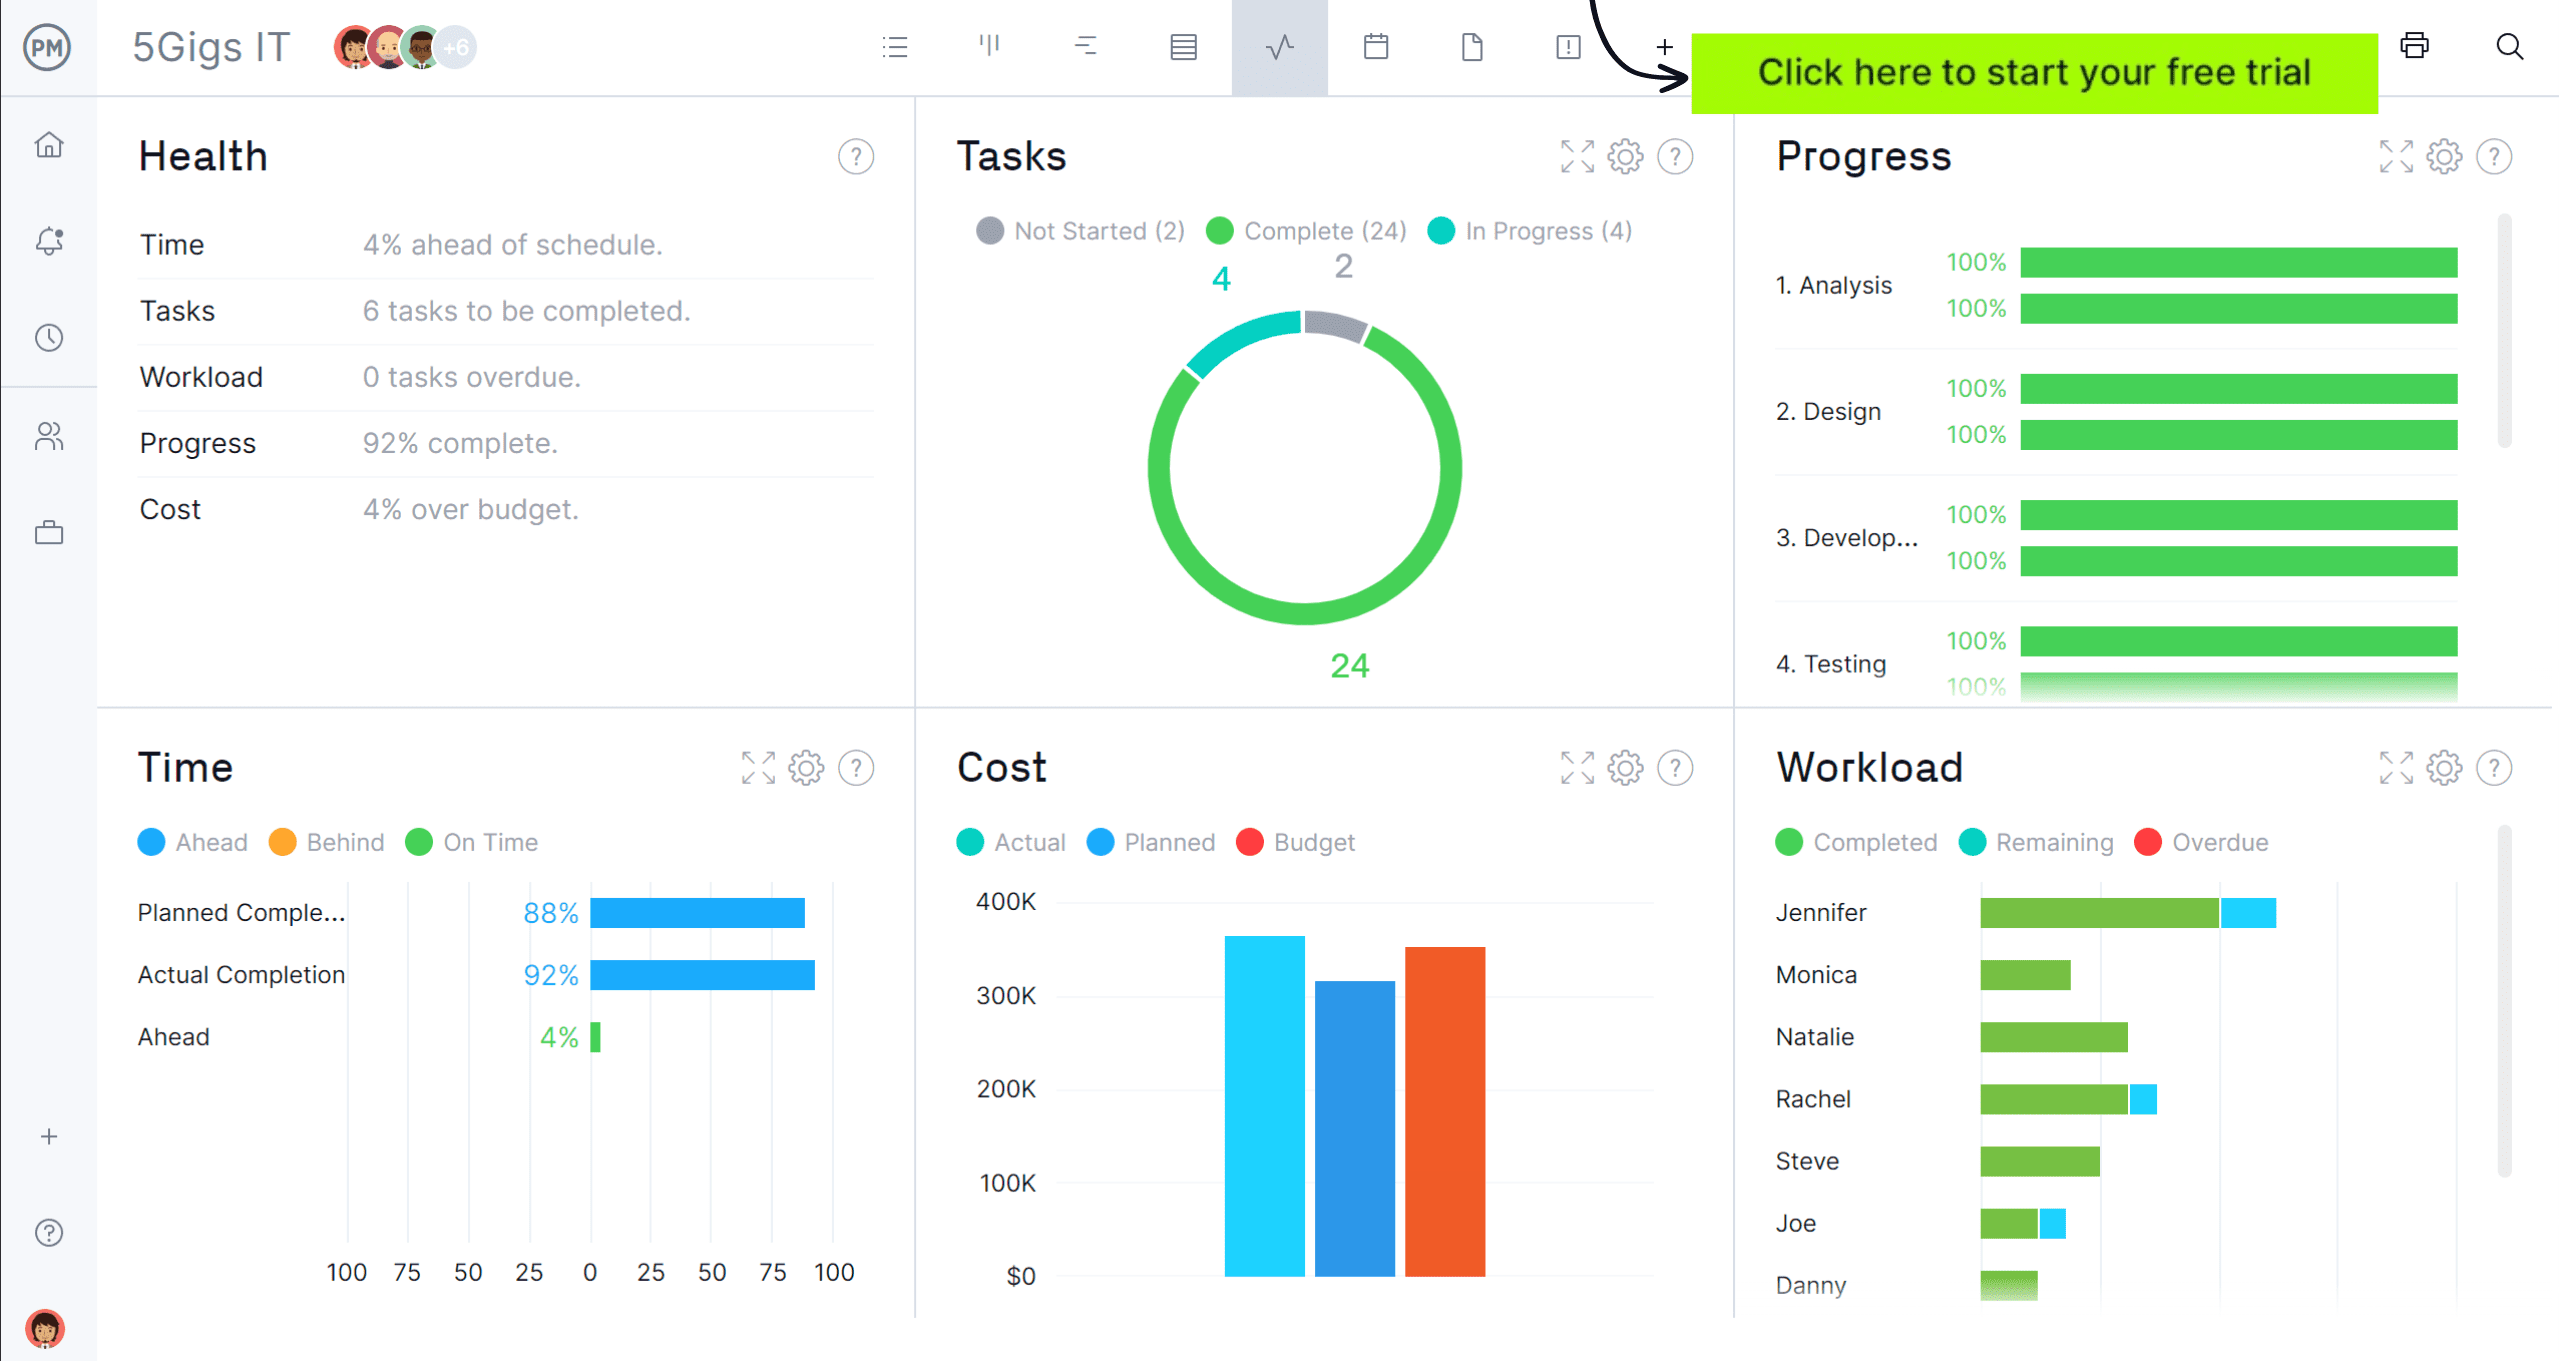
Using a KPI dashboard shows how well a project or organization is meeting its goals. These dashboards can identify trends, monitor progress and allow for data-driven decision making. Some metrics that can be displayed on a KPI dashboard include revenue growth, profit margins, customer satisfaction and employee engagement. For projects, charts can show the progress of tasks completed, team workload and more.
When creating a KPI dashboard, first determine which metrics are crucial for achieving the team’s goals. It’s advisable to focus on identifying these key metrics rather than cluttering the dashboard with unnecessary information. To define those KPIs, use SMART goals, which are specific, measurable, achievable, relevant and time-bound.
The best KPI dashboard captures real-time data, which means managers are making decisions with what is currently happening rather than directing the project or organization on yesterday’s news. Project management software can deliver live data to KPI dashboards. ProjectManager is award-winning project and portfolio management software with real-time KPI dashboards that can capture metrics for one project, a program or a portfolio of projects. Unlike lightweight KPI dashboards, ours doesn’t require any lengthy and complex setup. It’s ready to deliver a status report whenever needed. Get started with ProjectManager today for free.
KPI Dashboard Examples
There are many different types of KPI dashboards. We’ve only mentioned two, one for projects and another for organizations, but at least a handful can be used to track progress and performance in many industries. Here are some examples of different KPI dashboards.
- Business KPI Dashboard: A visual tool that displays KPIs, which are quantifiable metrics that help a business meet its goals and make data-driven decisions. Different departments within an organization can use a business KPI dashboard and the metrics displays vary depending on the department using it.
- Project Management KPI Dashboard: This provides a visual representation of project information that’s used to measure project success. These KPIs identify areas of weakness and pinpoint progress. Project managers use the KPI dashboard to review progress, access pending tasks, review budgets, visualize team capacity, improve results, make better decisions and improve communication and alignment across departments.
- Marketing KPI Dashboard: This platform collects, tracks and displays data that helps marketers and sales teams understand information to make better data-driving decisions. Marketing KPIs show how well a marketing campaign is progressing towards its objectives. It includes metrics such as website traffic, lead generation, conversion rates, social media engagement, customer growth, revenue growth and marketing-attributed return on investment (ROI).
- Manufacturing KPI Dashboard: This KPI dashboard helps manufacturers monitor and review production. It provides data that allows them to identify areas for improvement, track changes and make strategic decisions. KPIs can be measured at different levels of a plan, from an organizational level down to process levels. Key metrics include overall equipment effectiveness (OEE), cycle time and capacity utilization.
- Financial KPI Dashboard: This is a comprehensive overview of an organization’s financial performance. It allows stakeholders to track and analyze financial indicators to monitor the company’s health, identify risks and make strategic decisions. Some examples of financial KPIs are working capital, current ratio, debt-to-equity ratio and operating cash flow.
Benefits of Using KPI Dashboards
There are many benefits of using a KPI dashboard. They help businesses improve efficiency, decision making and productivity. They can also identify trends, align goals and optimize performance. Using a KPI dashboard keeps businesses focused on KPIs that have the greatest impact and signal whether outcomes are aligned with targets. But that’s just the start. Here are a few more benefits of using KPI dashboards.
Monitor Employee Performance
The KPI dashboard can be monitored by setting goals based on an organization’s objectives and priorities. These can be tailored to individual goals. It also communicates those goals clearly and consistently to employees and tracks their progress, allowing managers to analyze the data against set targets and benchmarks.
Identify Bottlenecks and Optimize Workflows
KPI dashboards can identify bottlenecks by tracking metrics and providing insights into performance. Lead and cycle time data can identify delays in the delivery process, while performance metrics can identify inefficiencies. By incorporating efficiencies, production, inventory and resource utilization metrics, managers can get insights that allow them to streamline processes, identify bottlenecks and optimize daily workflows.
Optimize Resource Utilization
KPI dashboards can optimize resource utilization by providing real-time data. This helps management identify trends, which leads to more informed decision-making. Knowing the status of resources, the resource utilization rate, forecasting future resource needs and planning for optimizing resource usage are all part of analyzing the data from the KPI dashboard.
KPI Dashboard Excel Template
Now that a KPI dashboard has been well-defined and the benefits outlined, many will want to have a chance to take one out for a spin. Many project management software products have dashboards or varying sizes and abilities. Most of those require being set up in advance to reap the rewards of this valuable tool. But for those who want to kick the tires and see what all the fuss is about download this free KPI dashboard template for Excel.
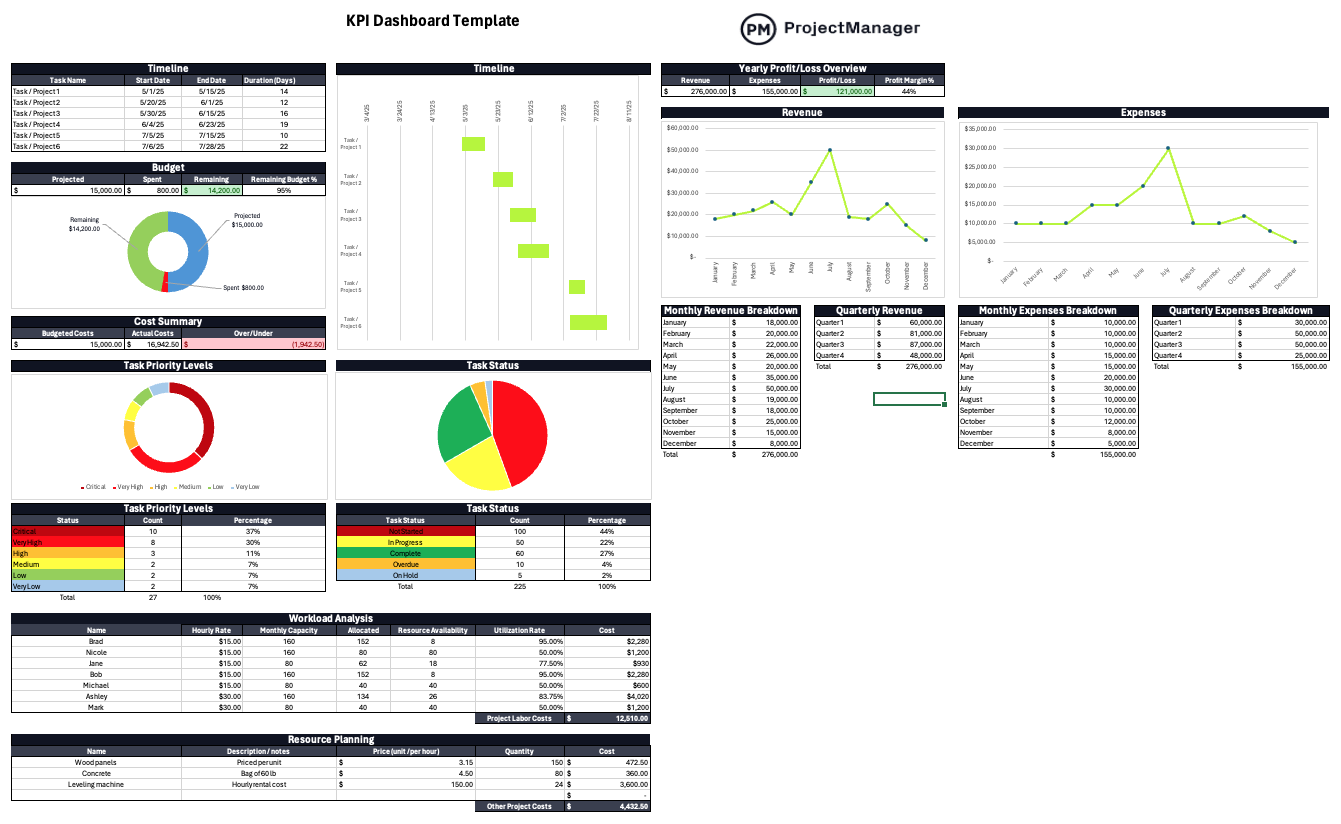
This customizable KPI dashboard template can track project tasks or a portfolio of projects. There are also charts to monitor project costs and track budgets to help keep projects and organizations to their budgets. This KPI dashboard template allows for tracking team workload and labor costs as well as monitoring the utilization of materials, equipment and other resources.
More Free KPI Tracking Templates
There are more free KPI tracking templates available on our site that can be used with the KPI dashboard template. We have over 100 free project management templates for Excel and Word that cover all phases of managing a project across several industries. Here are a few that can be used to track KPIs.
OKR Template
OKR stands for objects and key results. It’s used for setting goals that are challenging, actionable and measurable. This free OKR template for Excel helps organizations track the objectives and key results of each of their functional departments. It also captures priority levels, due dates, costs and more.
Project Dashboard Template
A project dashboard is a KPI dashboard used in project management. This free project dashboard template for Excel is made up of color graphs and charts that make it easy to see task progress, workload and costs at a glance. This bird’s eye view of the project allows managers to chart progress and make more informed decisions about the project.
Progress Report Template
Use this free progress report for Word to document the project’s progress and compare that to where the plan expected it to be. The progress report summarizes the scope, schedule, cost and risks while listing tasks that were completed during the period being reported. It also will list accomplishments made over that period and what is expected to occur over the next reporting period.
ProjectManager Is Ideal for KPI Tracking
KPI dashboard templates are not ideal. They give managers outdated information, which is going to negatively impact the decisions they’re making. That’s because these templates are static documents that don’t capture live data. They have to be manually updated, which not only dates the information but pulls one away from more valuable tasks. Upgrading to project management software can solve that problem, but not all project management software is created equally. ProjectManager is award-winning project and portfolio management software that has real-time project and portfolio dashboards that capture live data to make more informed decisions. But that’s only one KPI tracking feature.
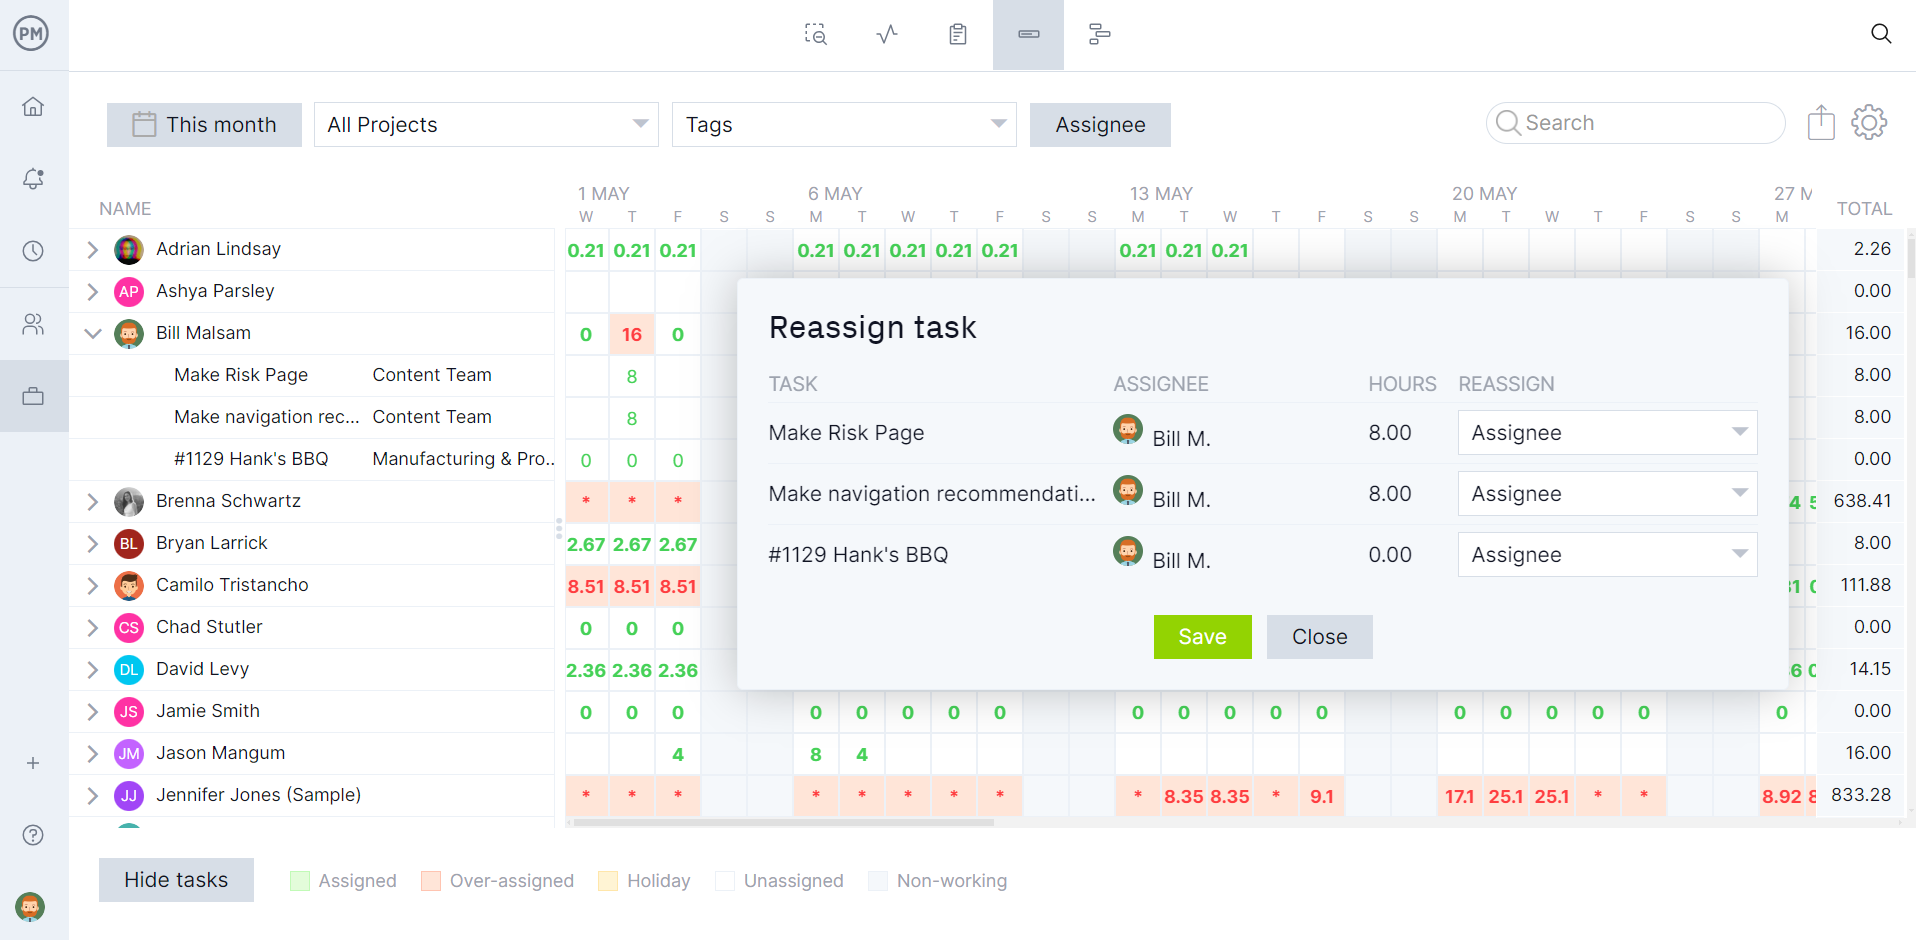
Monitor Resources to Keep Teams Productive
When onboarding teams, managers can set their availability to make it easier to assign them tasks. They can identify PTO, vacation time and even global holidays for distributed teams. Once the assignments have been made, managers can view the team page or the color-coded workload chart that provides an overview of resource allocation. Managers can see who on the team is overallocated or underutilized and then balance the team’s workload from that chart to keep everyone working at capacity.

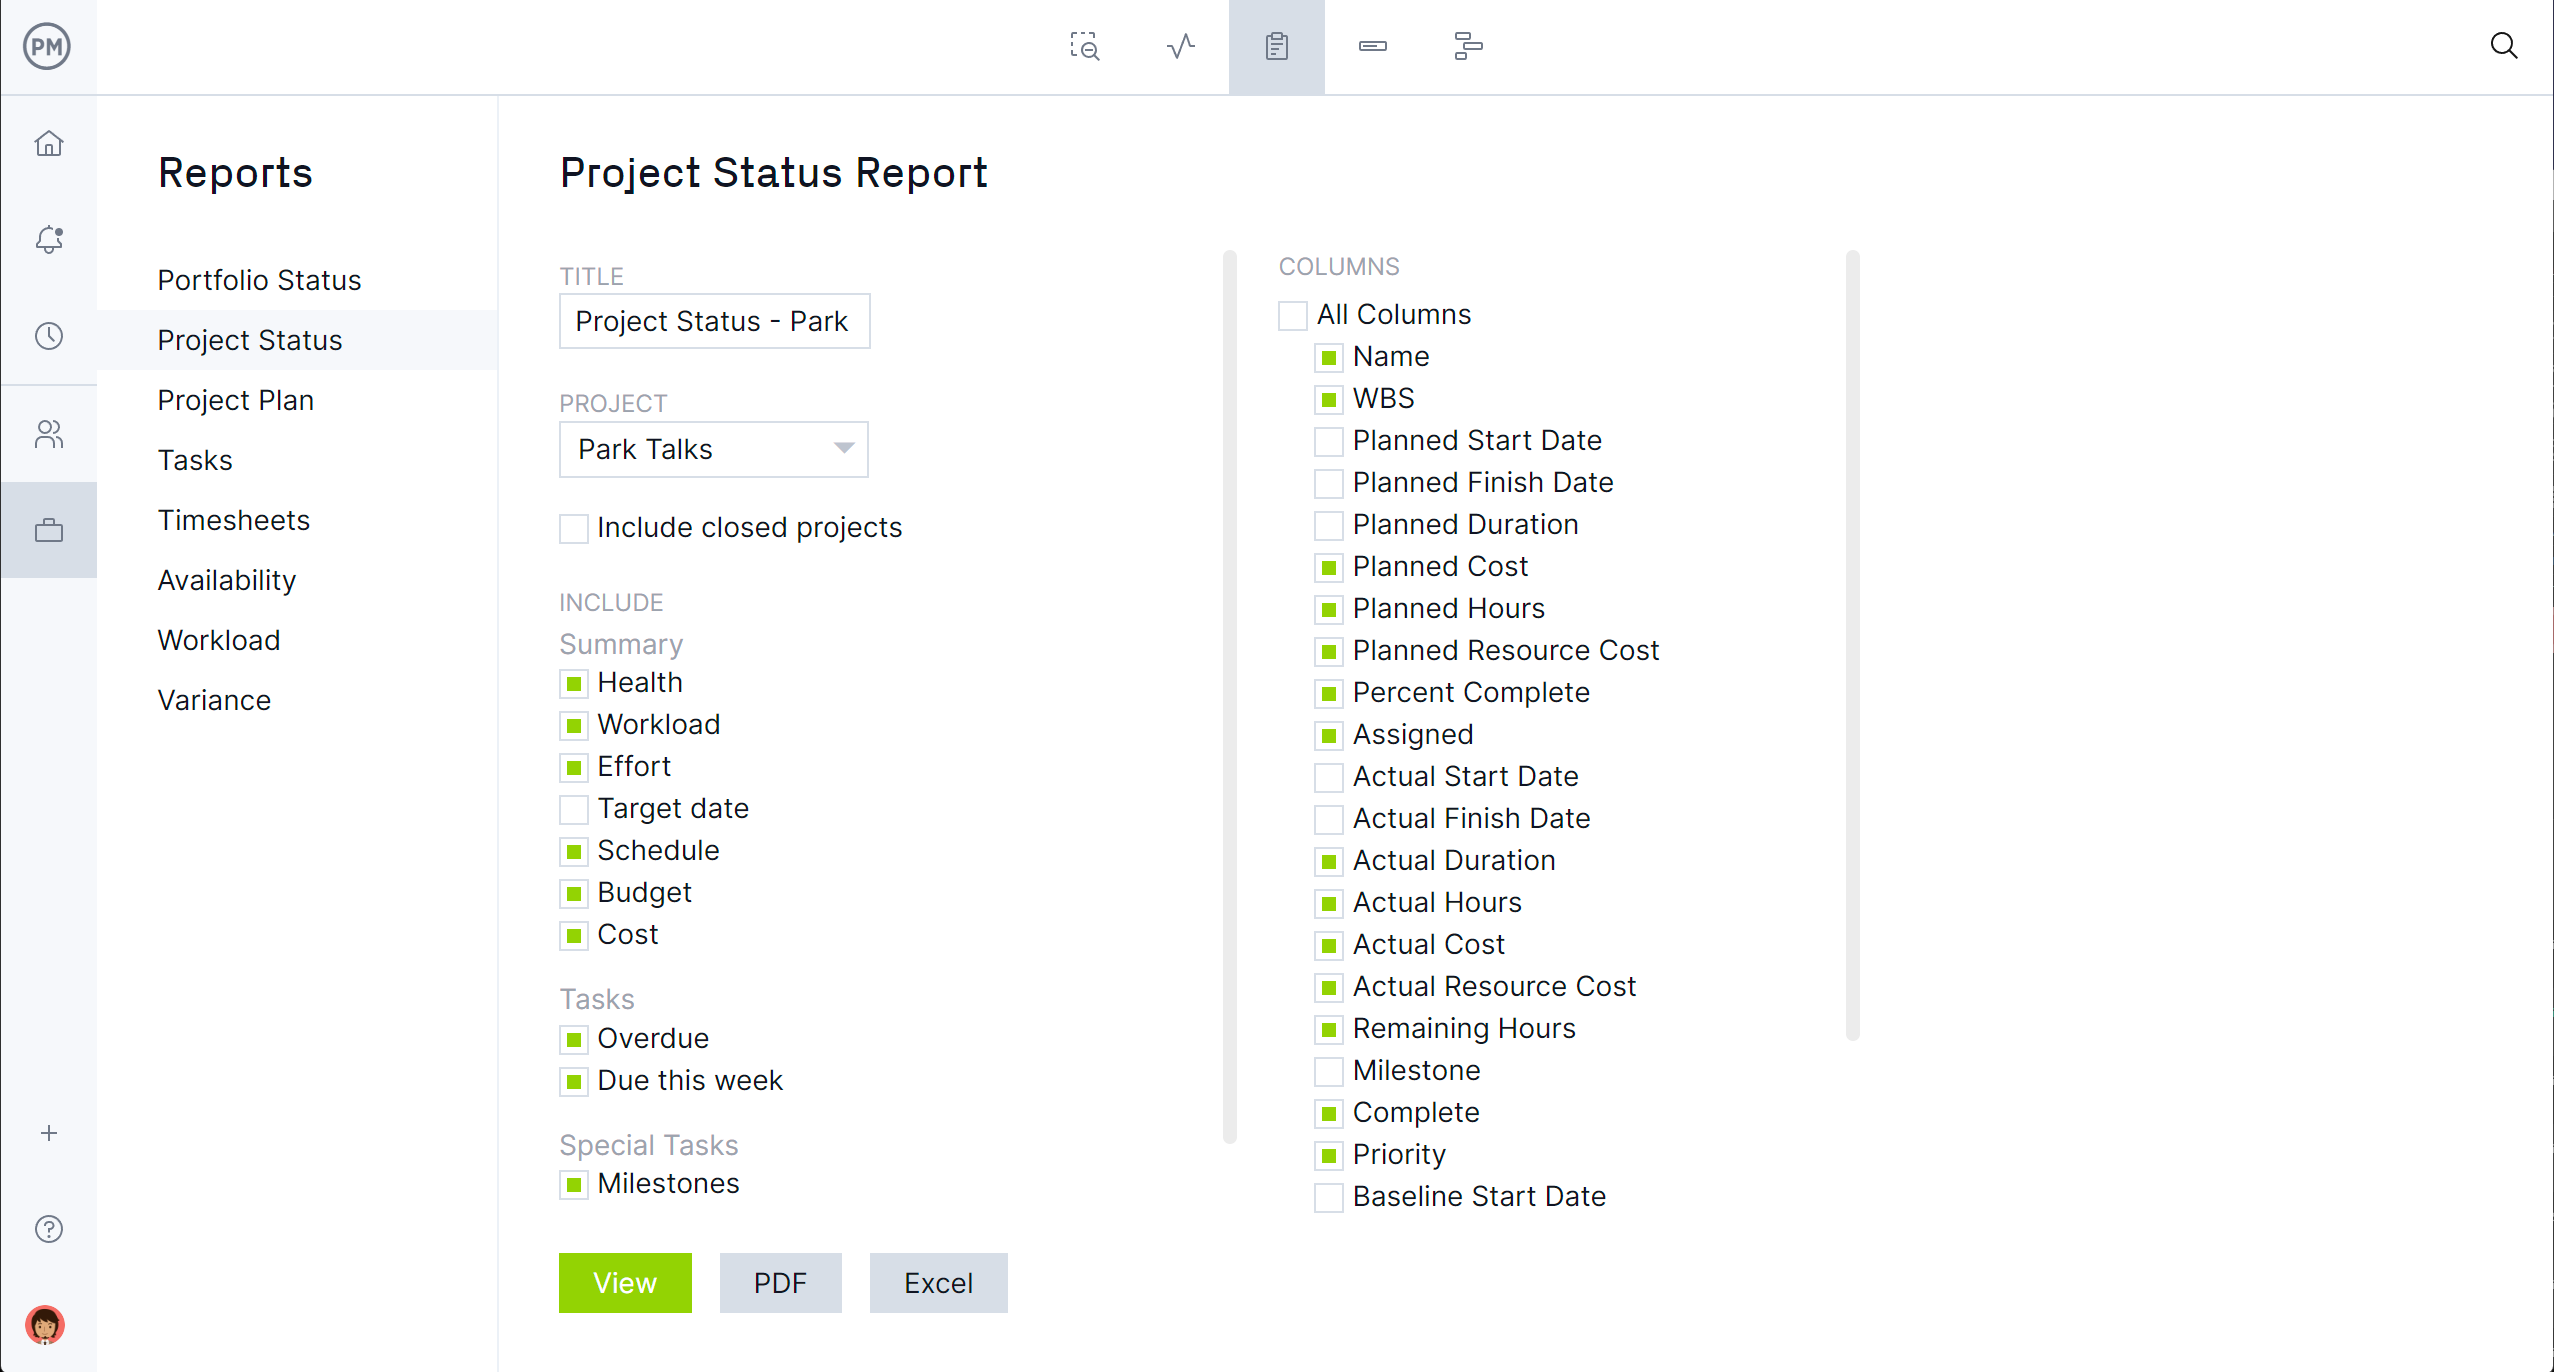
Get More Detailed KPIs With Reporting Features
When a high-level overview isn’t enough, toggle over to the reporting features. Reports can be generated with a keystroke and deliver data on project status and portfolio status as well as reports on variance, timesheets, workload and more. These are customizable reports, which means they can be filtered to go deep into the data for managers and their teams or create a more general summary that can then be shared to keep stakeholders updated on progress and manage their expectations.
Related KPI Content
There’s more to tracking progress and performance than a KPI dashboard. Dozens of KPIs can be used in project management, manufacturing and other fields. Read about the 10 essential team KPIs for any project, 20 production and manufacturing KPIs and metrics as well as learn how to create a Power BI dashboard by following the links below.
- 10 Essential Team KPIs for Any Project
- 20 Production and Manufacturing KPIs & Metrics
- How to Create a Power BI Dashboard: Pros & Cons
ProjectManager is online project and portfolio management software that connects teams whether they’re in the office or out in the field. They can share files, comment at the task level and stay updated with email and in-app notifications. Join teams at Avis, Nestle and Siemens who use our software to deliver successful projects. Get started with ProjectManager today for free.
