Monday.com is a recognized brand that has aggressively promoted its work management software to the general public. But is it project management software? One way to find out is by examining its features. For example, is there a Monday dashboard?
Project dashboards are essential project management tools. They offer an overview of key performance indicators (KPIs) that help project managers and team members keep track of schedules, budgets and resources. Let’s see if there’s a Monday.com dashboard and, if there is, if it lives up to industry standards.
What Is Monday.com?
Monday.com is a work operating system designed to help teams plan, track and manage their work. It’s an online platform that enhances collaboration, project management and workflow automation. The tool is made for various types of teams–from marketing, product development and IT to sales and operations–enabling users to streamline their processes, improve productivity and maintain visibility into the process of tasks and projects.
Founded in 2012 under the original name of Depulse, the software was developed to help teams collaborate and manage tasks, which developers felt was lacking in the marketplace. By 2017, the company rebranded as Monday.com and expanded beyond basic task tracking to a full-fledged work tool, allowing companies to manage everything from workflows to communications in a centralized space.
We’ll get to the Monday dashboard question in a moment, but first, let’s explore the features that fulfill its promise to “Work Without Limits.” At the heart of the software are boards, which allow teams to organize tasks and projects similarly to kanban, with rows and columns.
It also has automation to reduce manual work, integrates with many third-party apps and has time-tracking features to help teams log time spent on tasks or projects. Built on a collaborative platform, reporting tools, workload management and customizable templates exist.
Does Monday.com Have a Dashboard?
This leaves us with the question of whether there is a Monday dashboard. But first, a bit of information on why dashboards are so important to project managers and team members. Project dashboards are visual tools used to display key project data and metrics in a centralized location. They provide a quick view of the project’s status, progress and health through charts, graphs and tables.
The key features that users should be on the lookout for include delivering real-time data to reflect the most up-to-date status of the project. These visual tools make it easier to digest data in a centralized overview of a project or multiple projects. They compare the plan against the actual progress to help steer the project to a successful end through improved decision-making.
Short Answer: Yes, Monday.com Has a Dashboard
The Monday dashboard can do many things, but it also lacks features that project managers and their teams need. While it has the basics, such as customizable widgets, data consolidation, real-time updates tracking workload, deadlines and more, it doesn’t go the extra mile to provide the robust metrics that help guide projects to successful completion.

Long Answer: Monday.com Dashboards Lack Key Features for Project Management
The Monday dashboard has many issues that make it not ideal for those looking for superior project management software. For instance, it has limited customization of widgets and visualization and scaling issues, which makes it a poor choice for larger projects. Performance lags when working with large teams or complex workflows. That’s only the beginning of the criticisms, though.
- Not Ideal for Project Portfolio Management: Dashboards are more suited for tracking individual boards or a limited scope of projects. They lack robust, high-level tools to manage and prioritize an entire project portfolio, such as interdependencies between projects or portfolio-wide resource planning.
- Lack of Planned vs. Actual Comparisons: While Monday.com dashboards provide real-time data, they don’t inherently include planned vs. actual performance comparisons unless users create custom workarounds or integrations. This makes it harder to track variances or delays against the original project plan.
- Doesn’t Show the Percentage of Completion of Tasks: Dashboards don’t intuitively display the percentage of task completion. Users must manually set up progress indicators like the “Battery” widget, which may not always meet detailed tracking needs.
Those who want a powerful project dashboard turn to ProjectManager, an award-winning project and portfolio management software with real-time project and portfolio dashboards. That means project managers and team members can get a high-level overview of a significant project, program or portfolio of projects. Dashboards have easy-to-read graphs and charts that show metrics such as time, cost, workload and more, with planned vs. actual effort and percentage of completion. Get started with ProjectManager today for free.
Cons of Making a Monday.com Dashboard
Another issue with a Monday dashboard is that users have to build it. Unlike ProjectManager, where the dashboard is ready to view immediately upon setting the baseline in the Gantt chart, Monday.com requires users to customize and build their dashboards from scratch, selecting the data they want to visualize and how they want it displayed. The issues with this are as follows.
- The setup is time-consuming and achieving the ideal dashboard may require several iterations
- There’s a learning curve to understanding how to connect multiple boards, adjust widgets and choose the right metrics and know the data structures within the software to link them effectively, which can be confusing
- A variety of pre-built widgets limit customization and there’s a lack of advanced data visualization
- Ongoing maintenance is required as projects evolve or new data is added, and if a team or project workflow changes, users might have to redesign or update the dashboard
- It’s not easy to track dependencies across projects, especially with multiple teams or projects that are highly interconnected
- Premium features are behind paywalls and for teams or businesses on a budget, the additional cost of upgrading to access these features is a drawback, especially compared to competitors that offer these features in lower-cost versions
How to Make a Monday.com Dashboard Better With ProjectManager
Importing a project from Monday.com to ProjectManage illustrates the advantages of using our dashboard over a Monday dashboard. Not only are users getting a more useful dashboard feature, but access to superior Gantt charts, secure timesheets and more detailed analytics. Simply take a free 30-day trial of ProjectManager, no credit card required, and follow these simple steps.
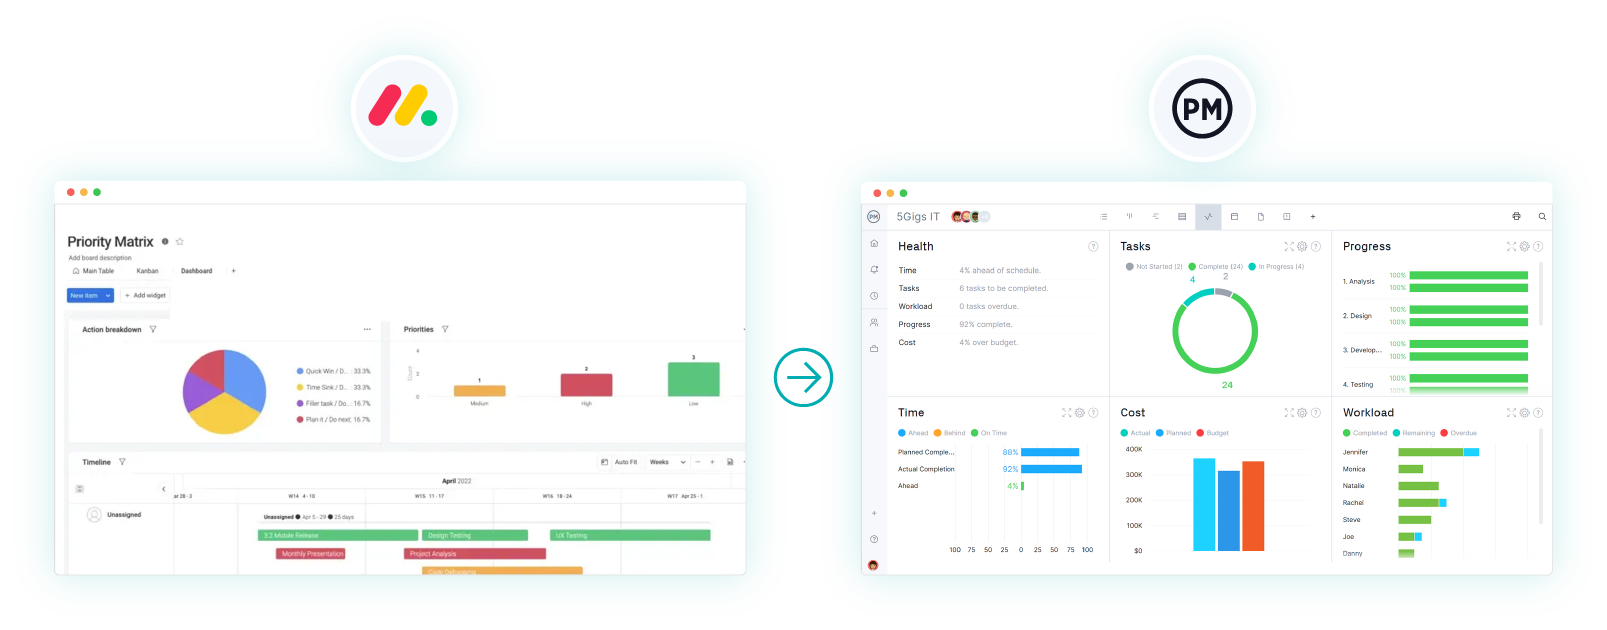
1. Export Your Monday.com Project
Begin by exporting the project data from Monday.com into an Excel file. This will allow you to transfer the information to ProjectManager.
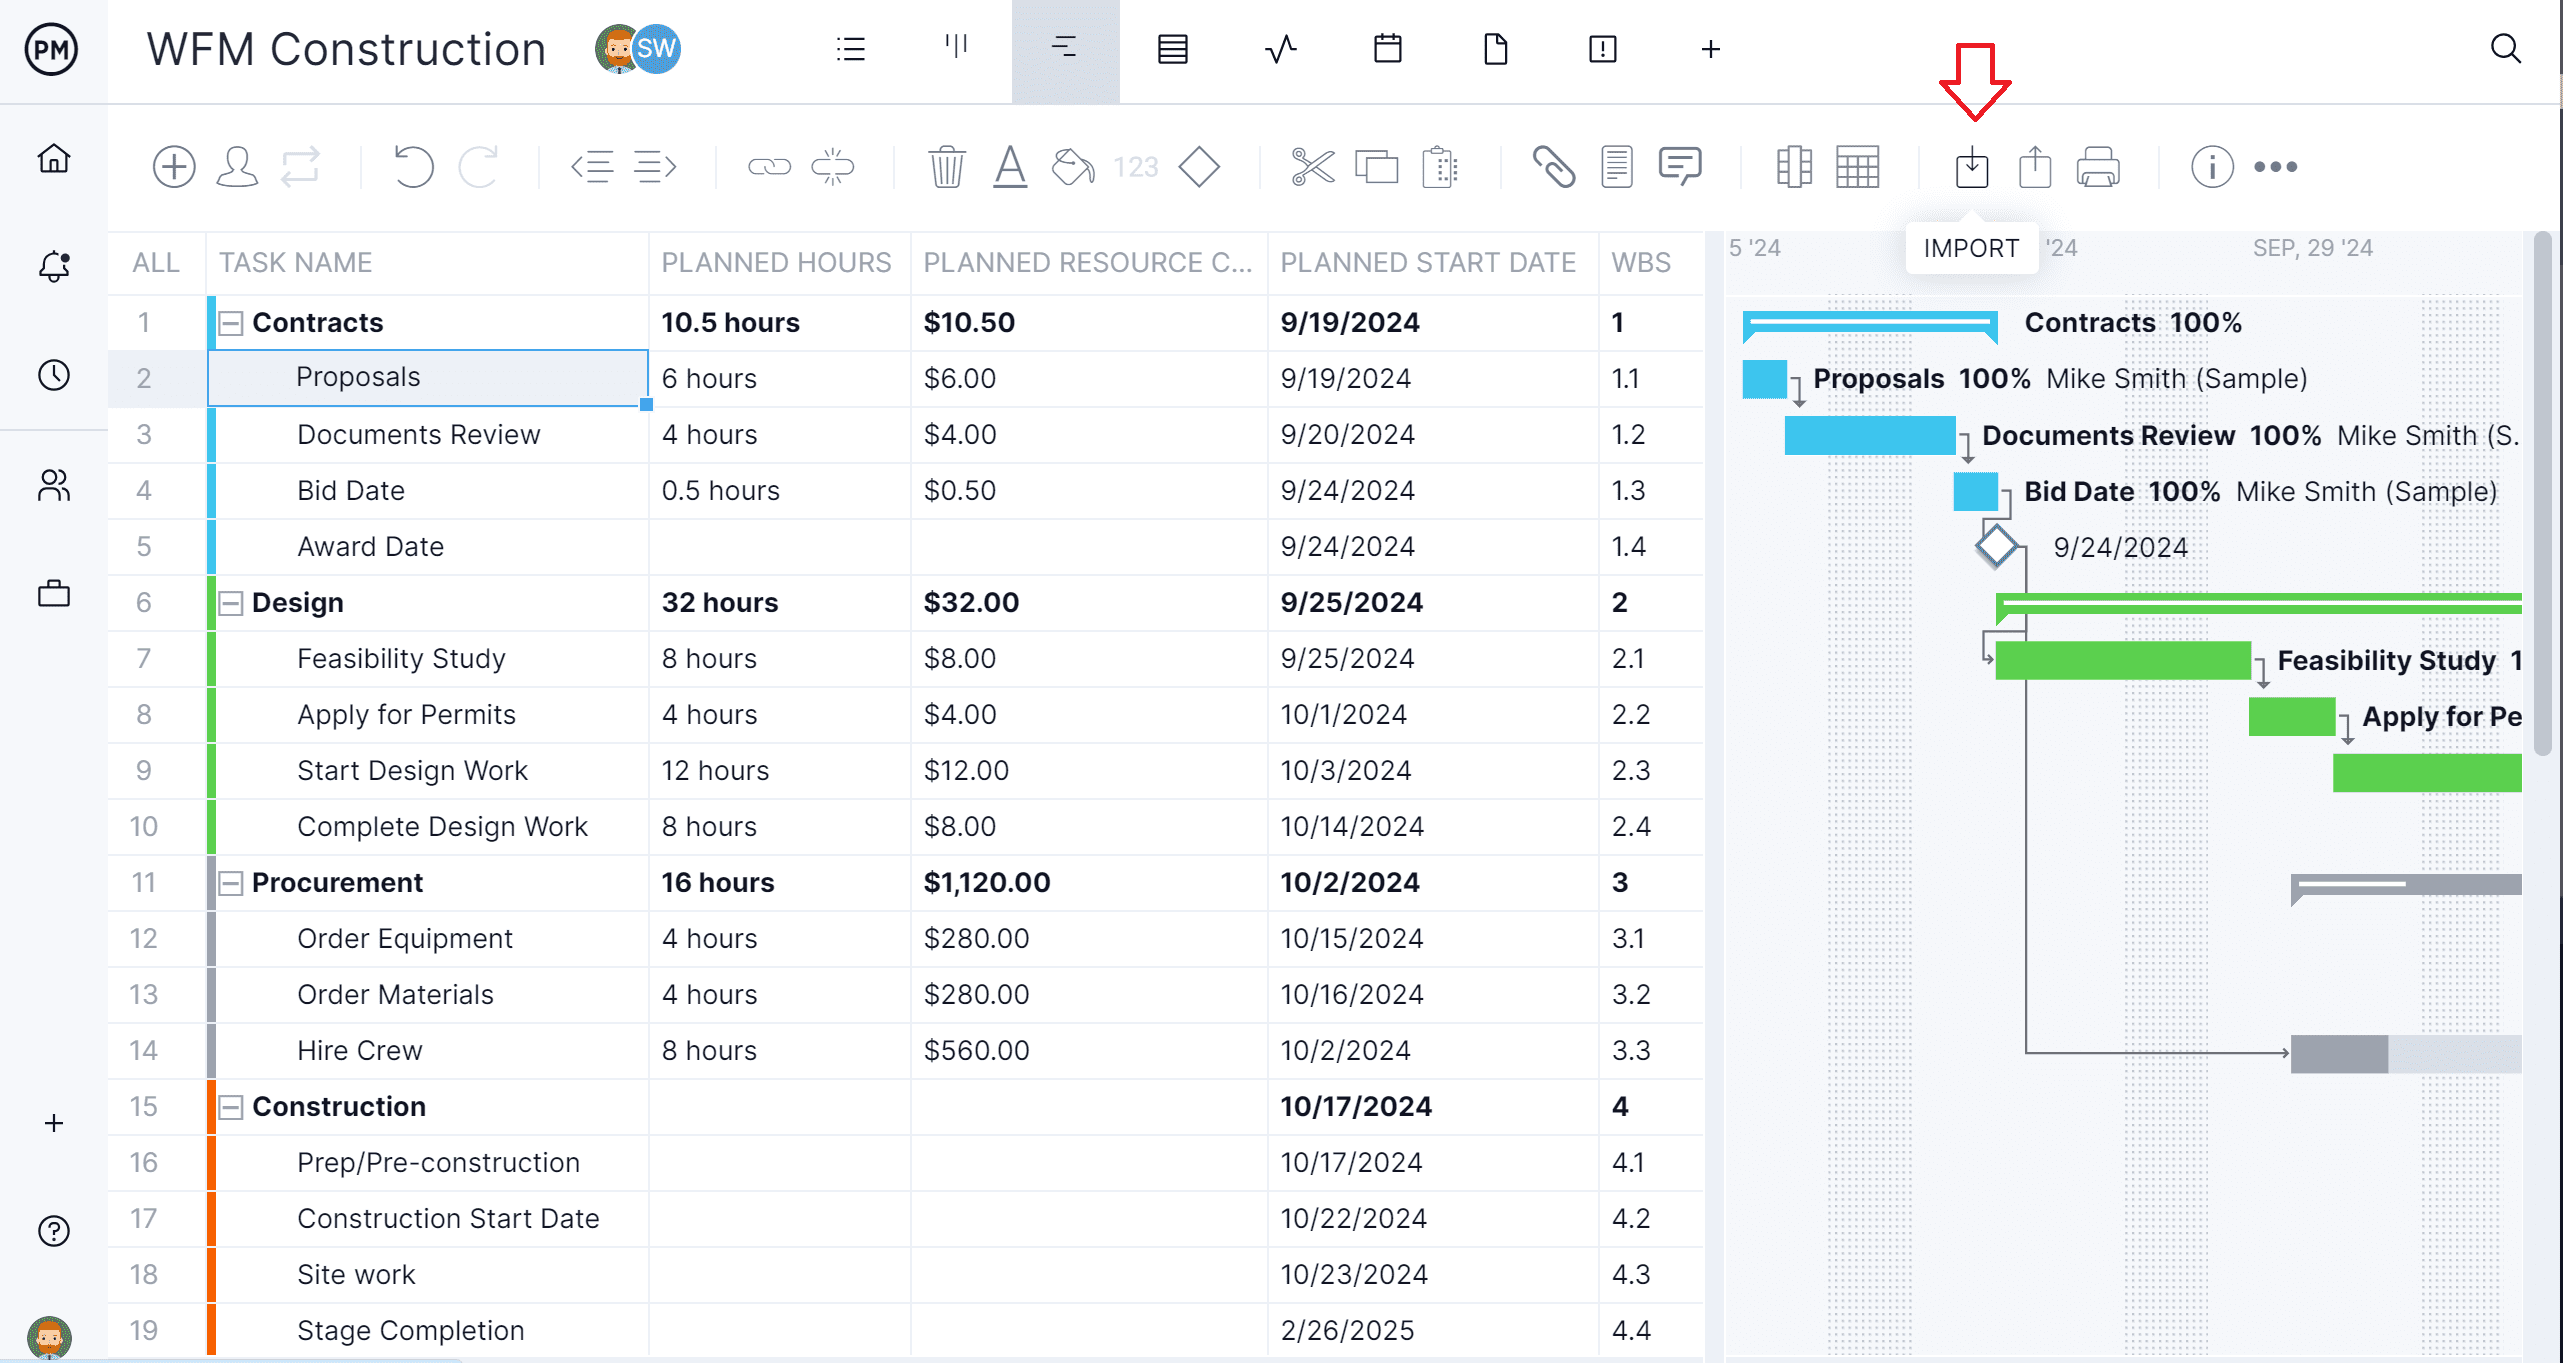
2. Select the Excel File and Import Into ProjectManager
Open ProjectManager and navigate to the import section on the Gantt chart. Choose the Excel file you just exported from Monday.com and upload it into ProjectManager.
3. Add the Data to a New or Existing Project
Once the file is uploaded, you can either create a new project or add the data to an existing project in ProjectManager. This flexibility lets you choose how to organize your tasks and workflows.
4. Choose What Data to Import & Toggle to the Dashboard View
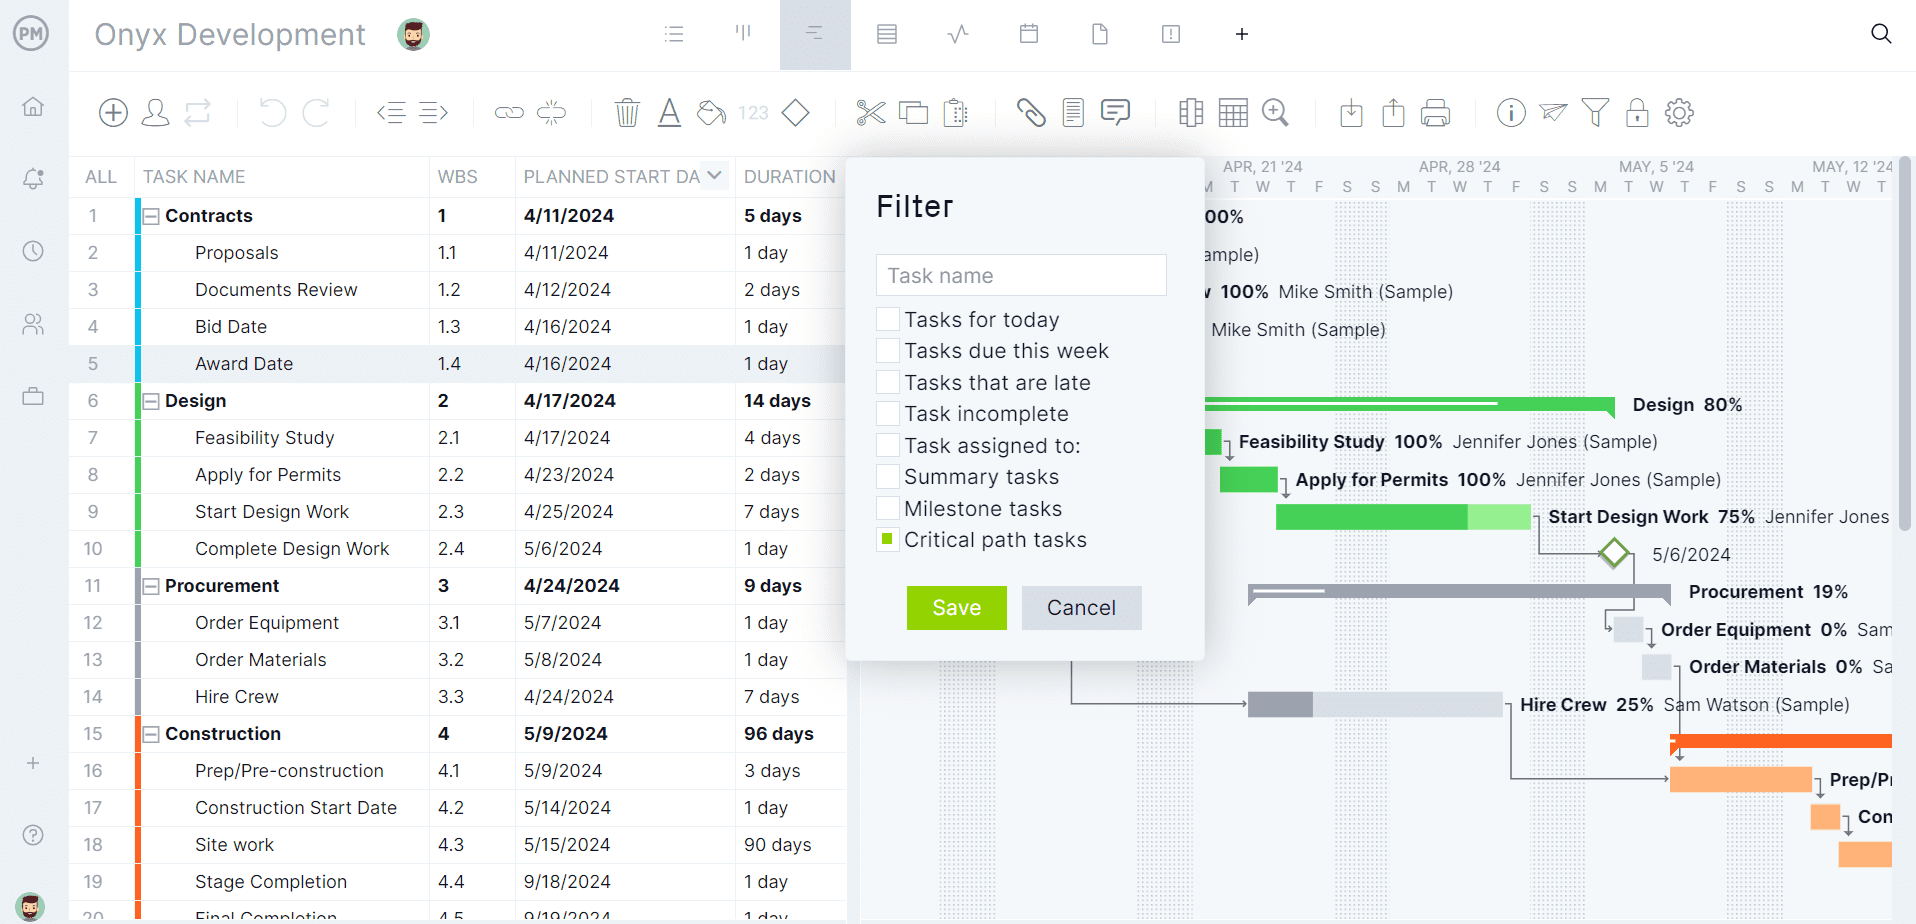
During the import process, you’ll be prompted to select the specific data points you want to import. You can filter the data to include only relevant tasks, milestones, deadlines or other important metrics. Remember to set a baseline on the Gantt chart to compare actual versus planned data. Once the data populates, toggle to the dashboard view to see live project data.
5. Success! View Monday.com Dashboard Data in ProjectManager
After the import is complete, you can now view your Monday.com project data in ProjectManager’s enhanced dashboard, which offers advanced project management tools such as Gantt charts, task assignments and real-time reporting.
ProjectManager Has a Better Dashboard than Monday.com
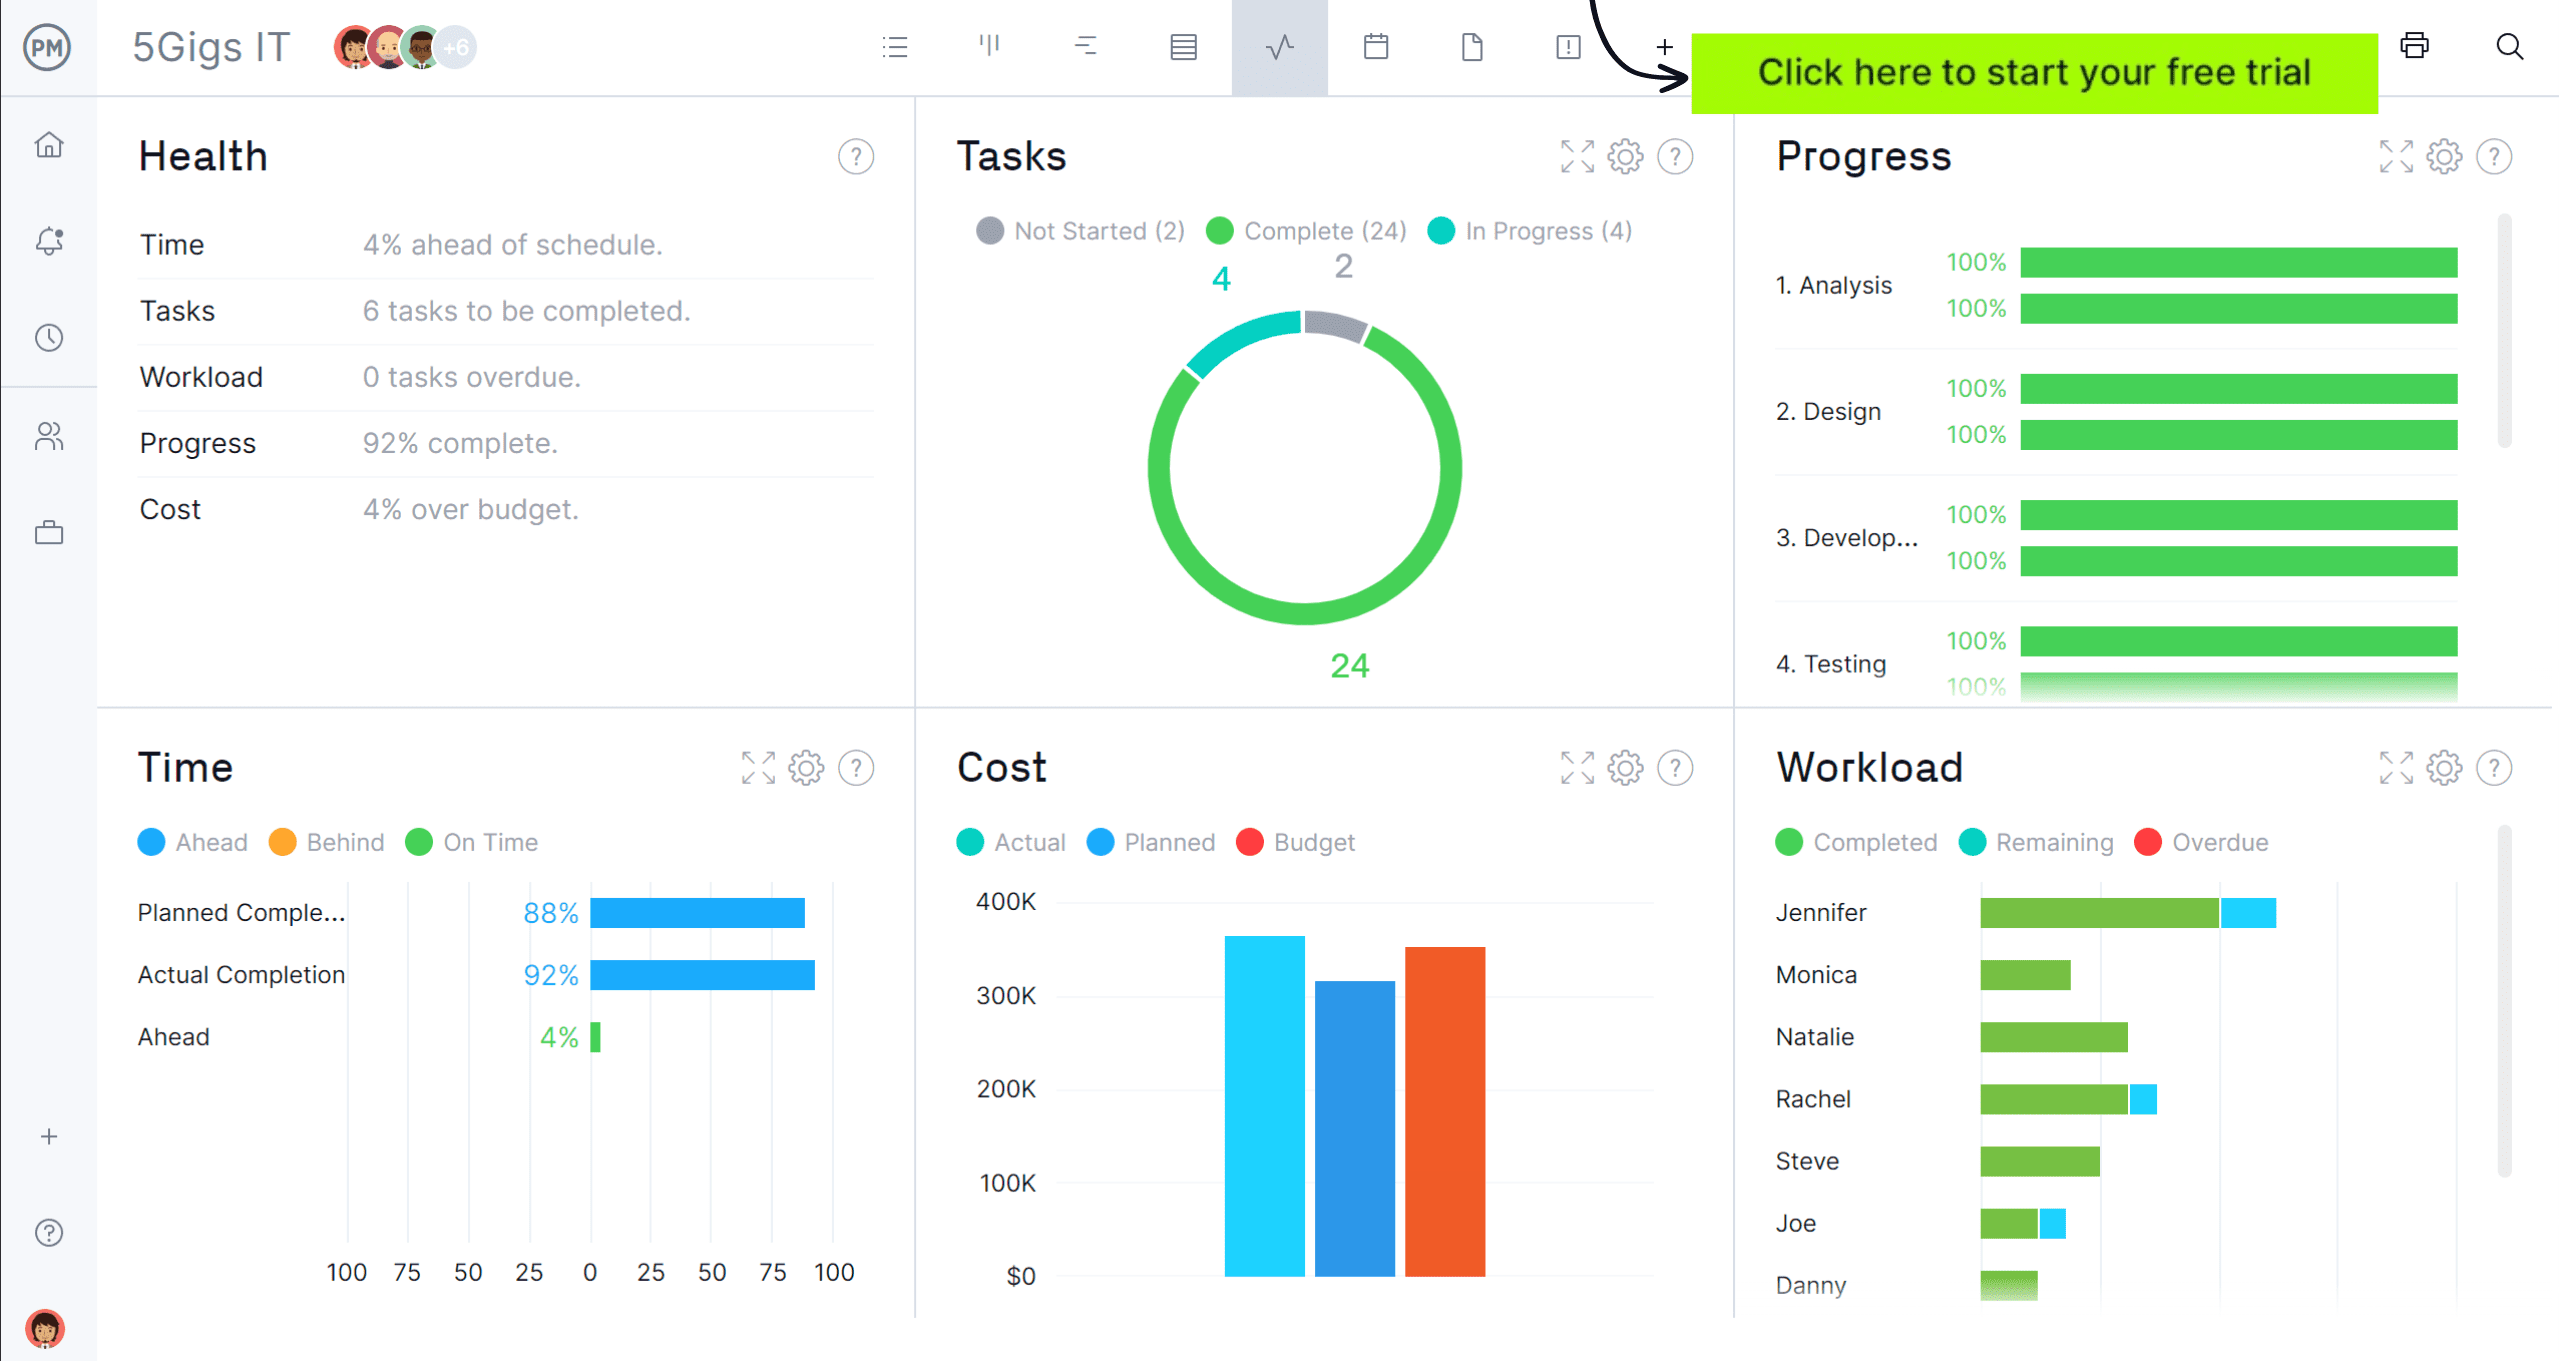
While a Monday dashboard offers basic project management features, ProjectManager takes it a step further with its advanced dashboard capabilities. It provides comprehensive tools for monitoring progress, tracking costs, managing workloads and more. Here’s a breakdown of how ProjectManager’s dashboard features stand out:
- Project Portfolio Management Dashboard: ProjectManager allows you to manage multiple projects from a single view, offering an at-a-glance overview of all active projects. Users can track key metrics, timelines and resource allocation across the project portfolio, helping to prioritize and make data-driven decisions.
- Planned vs. Actual Project Management Data: This feature compares a project’s planned milestones and timelines to the actual progress. With ProjectManager, you can instantly identify discrepancies and adjust project plans to stay on track, providing better insight into project health.
- Progress Tracking: This compares a project’s planned milestones and timelines to the actual progress. With ProjectManager, users can instantly identify any discrepancies and adjust their project plan to stay on track, providing better insight into project health.
- Cost Tracking: Keep a close eye on the project’s budget with ProjectManager’s detailed cost-tracking features. It tracks actual spending versus budgeted costs, helping to ensure the project stays within financial limits and providing transparency to stakeholders.
- Workload Management Data: Monitor the team’s workload, ensuring that tasks are balanced and resources are appropriately allocated. The dashboard shows real-time data on team capacity, task assignments and potential overages, helping prevent burnout and optimizing team productivity.
- Slippage Reporting: This allows you to track delays and deviations from the project schedule. This feature helps you identify causes of slippage, whether it’s resource issues or task delays and take corrective actions before they impact the overall timeline.
Monday.com Dashboard Example
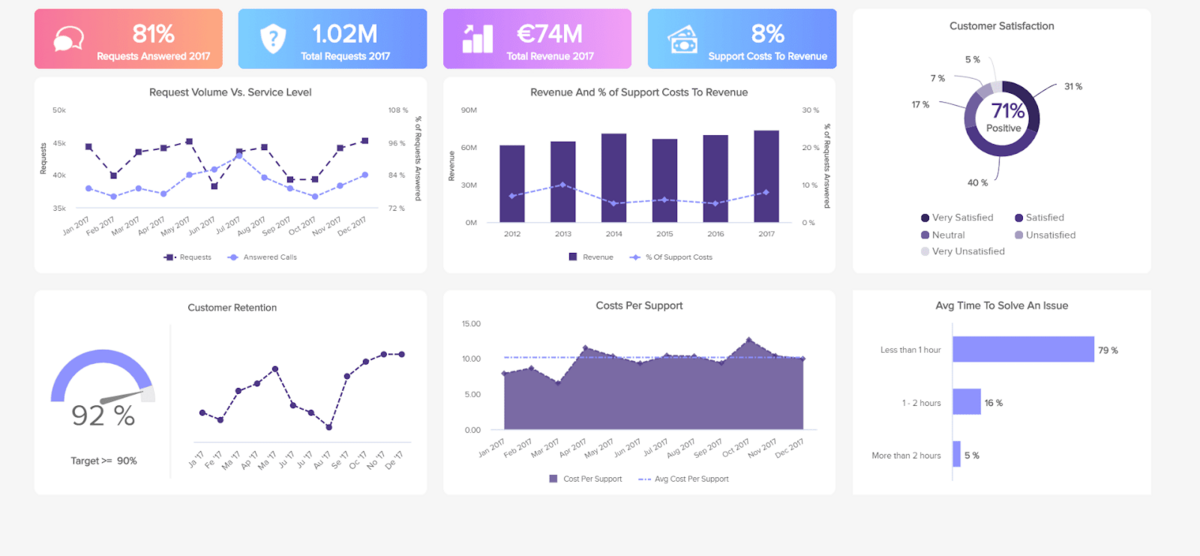
Let’s look at a Monday dashboard to see how it works. The one illustrated below is for a sales team. As with any visual analytic tool, this one is made up of bar graphs and other types of charts.
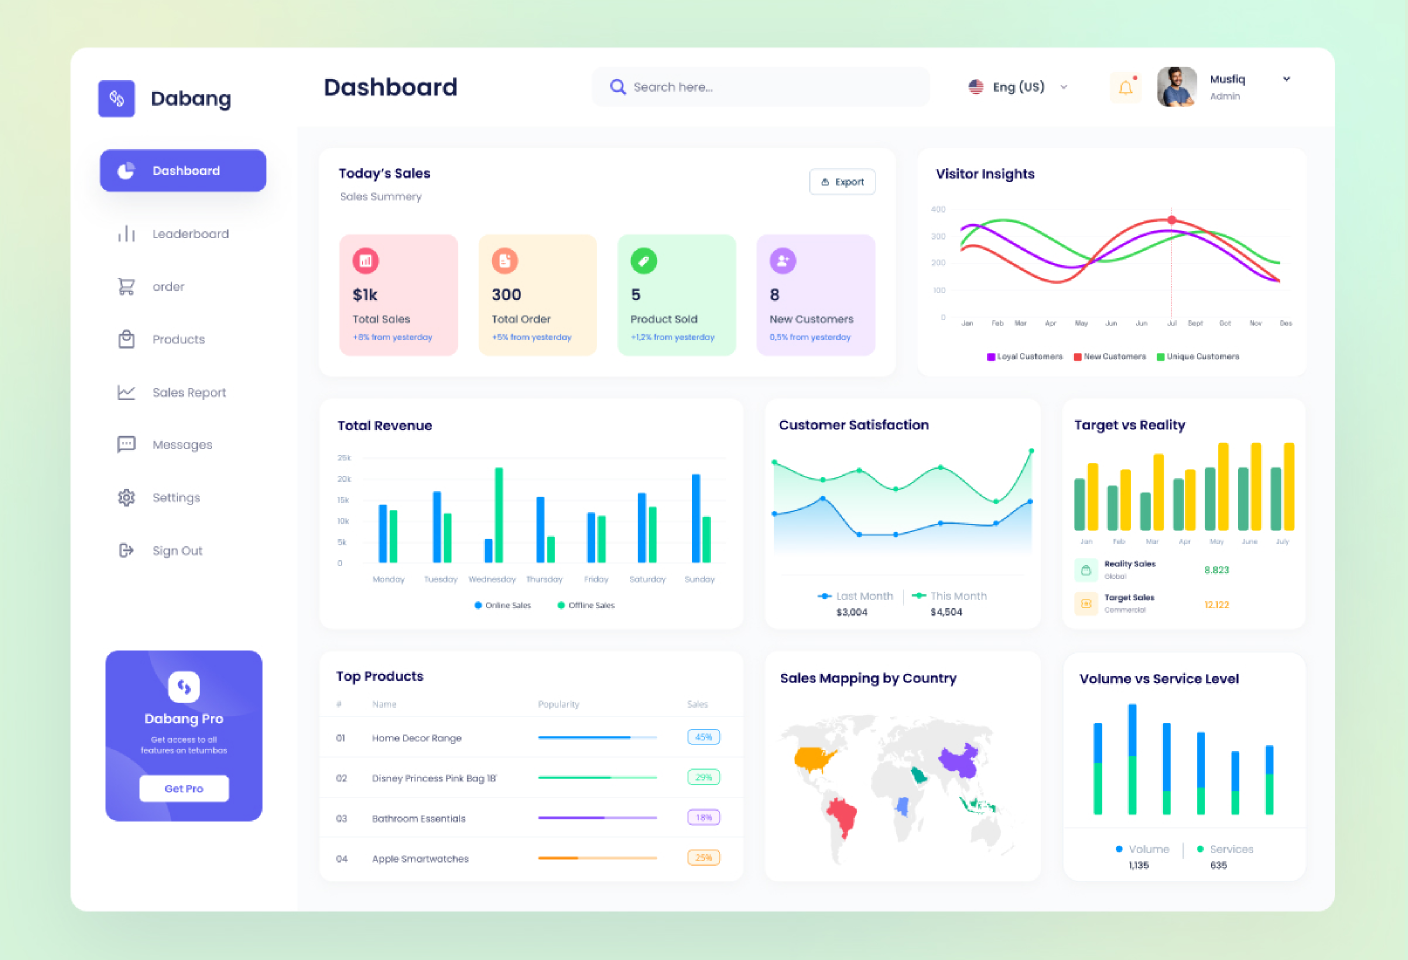
For example, there’s a bar chart that tracks the total revenue over time. A list of top projects is also provided, as well as a map to show sales by country. Another bar chart captures volume vs. service levels. This Monday dashboard example is a fair representation of how the software works.
How to Make a Dashboard In Monday.com
For those who don’t want to upgrade, here’s a tutorial on how to create a Monday dashboard. Start in the software by selecting the dashboard tab. Click “create new dashboard” and name it. Choose from a variety of pre-built widgets and select the specific boards and data you want to display for each.
At this point, customize the widgets to display the relevant data. This involves linking your boards and understanding what data is needed to showcase. Now, organize the widgets and fine-tune the layout for readability. As projects evolve, regularly update and adjust the dashboard to reflect changes.
As noted, this is time-consuming and can be difficult. The Monday.com dashboard isn’t fully customizable and limited by the pre-built widgets. There are also issues with linking multiple boards, selecting relevant data and ensuring it flows smoothly. It’s a trial-and-error effort and not workable with multiple projects.
Why ProjectManager Is a Better Project Tracking Software Than Monday.com
The Monday dashboard might be helpful for individuals trying to work more productively, even smaller teams could find it useful. However, any project management professional will balk at wasting time creating a dashboard and then having that dashboard not be able to do fundamental project tracking functions, such as comparing planned against actual effort or monitoring multiple projects in one place. That’s why project managers and their team members choose ProjectManager, an award-winning project and portfolio management software with powerful dashboards and more.
Plan, Schedule and Track With Multiple Project Management Views
Like Monday.com, our software has multiple project views. Unlike Monday, though, we have a real Gantt chart that schedules tasks, resources and costs. More than that, it can link all four types of task dependencies to avoid delays and cost overruns that impact the budget and schedule. Once a plan is in place, set a baseline to track progress in real time. These plans are shared across the software, allowing teams to manage their work on kanban boards that visualize workflow or task lists that prioritize, tag and track progress. There’s even a calendar view that stakeholders can use to stay updated on progress.
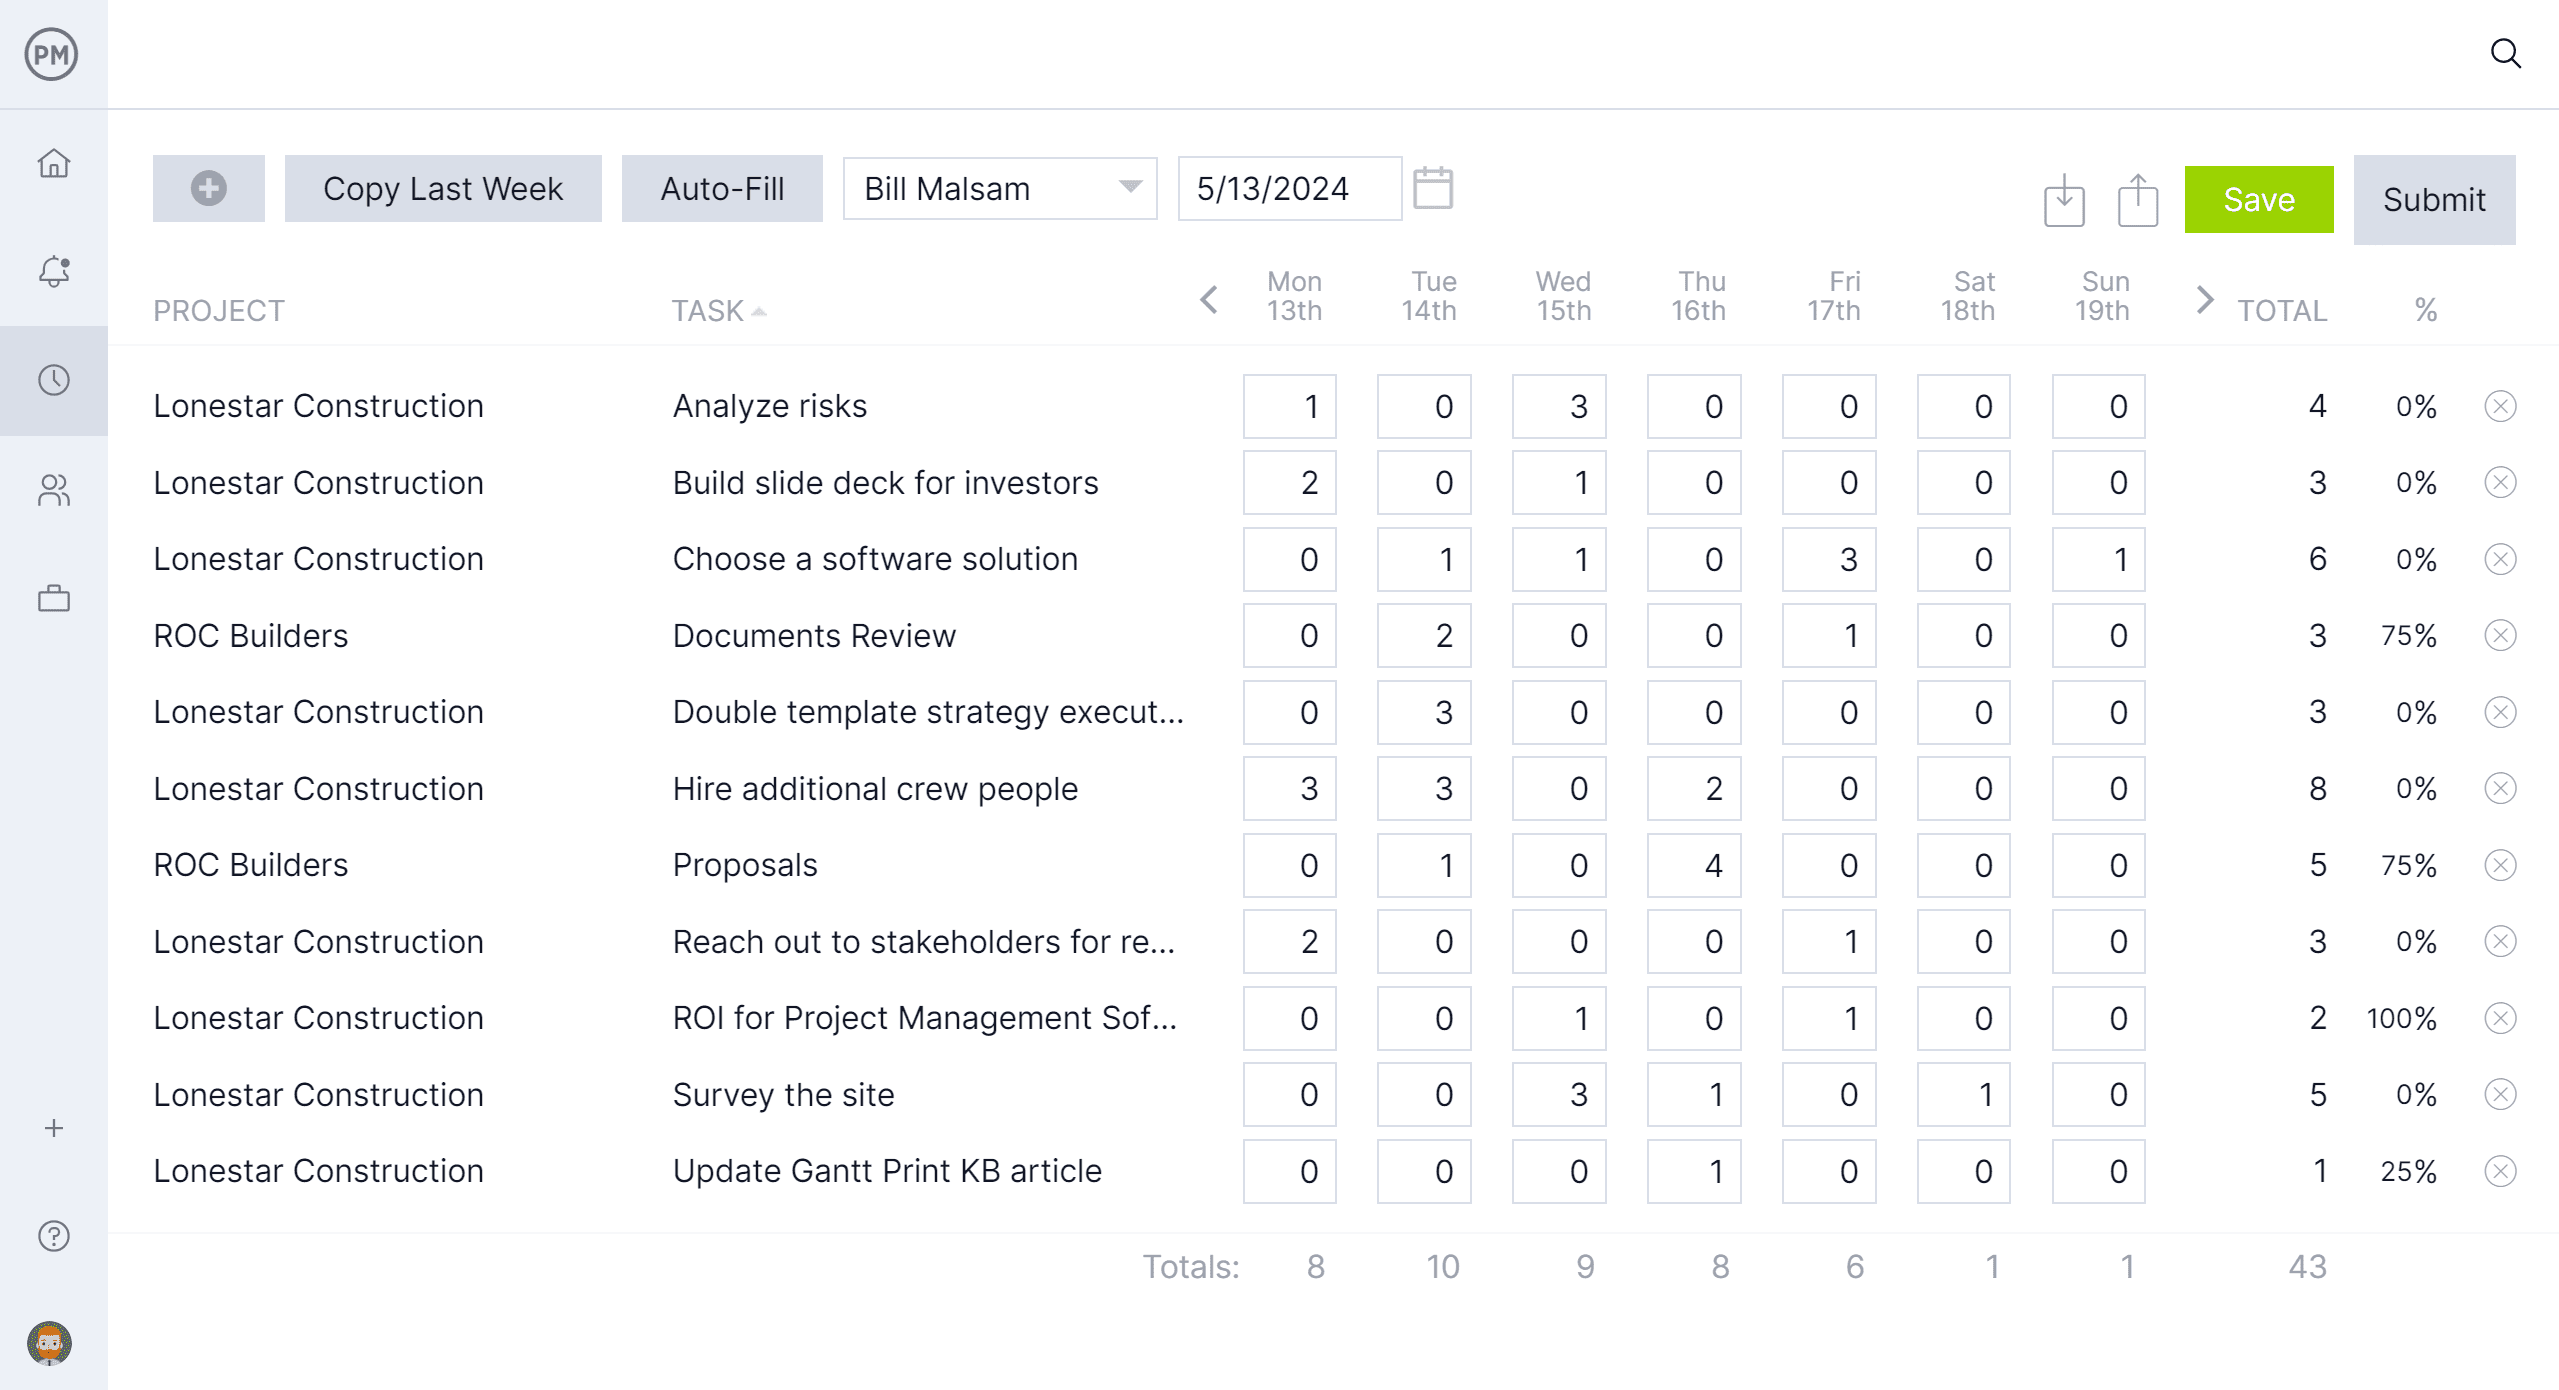
Track Costs with Online Timesheets, Workload Charts and Reports
There are more ways to track work than just the high-level view provided by our dashboards. For example, secure timesheets can streamline payroll but are also a window into labor costs to help keep to the budget. They also monitor how much work each team member is doing compared to their assignments. Color-coded workload charts offer a view into resource allocation, showing who’s overallocated or underutilized. Managers can balance their team’s workload from the chart to keep teams working at capacity without threatening burnout. Customizable reports can be filtered to go into detail or summarize progress and shared with stakeholders to keep them informed.
Related Monday.com Content
This isn’t the first time we’ve reviewed Monday.com or wrote about the importance of dashboards. For those looking to read more on those topics, check out the links below. They lead to recent posts on Monday.com alternatives, free templates and much more.
- Best Mondayu.com Alternatives Free & Paid Options
- Monday.com Gantt Chart: How to Make a Gantt Chart With Monday.com
- Project Dashboard Template (Free Excel Download)
- KPI Dashboard Template
- Budget Dashboard Template for Excel (Free Download)
ProjectManager is online project and portfolio management software that connects teams whether they’re in the office or out in the field. They can share files, comment at the task level and stay up to date with email and in-app notifications. Join teams at Avis, Nestle and Siemens who are using our software to deliver successful projects. Get started with ProjectManager today for free.
