Scheduling production, planning a budget and allocating resources only sets up manufacturing for success. Monitoring and controlling that process ensures that deadlines are met and costs aren’t exceeded. One way to keep track of the manufacturing process is with a production report.
To take advantage of this useful manufacturing tool means first understanding what production reporting and a production report are. To make production reports even clearer, we’ll then outline a production report example. Finally, we’ll add links to free project management templates to help manufacturers deliver on time and within budget.
What Is Production Reporting?
Production reporting is a process managers use in manufacturing to analyze, visualize and understand the current state of the production process. It can also compare with historical performance to provide some context to the data.
We’ll get into what’s included in a production report in greater detail, but usually, they include dashboards, reports, charts, graphs and other ways to display data to make it easier for managers and stakeholders to understand various production key performance indicators (KPIs).
Production reporting is also used to identify weaknesses that can be addressed and resolved to have production run more efficiently. Some issues that a production report can capture include bottlenecks, unplanned downtime and poor machine utilization.
Get your free
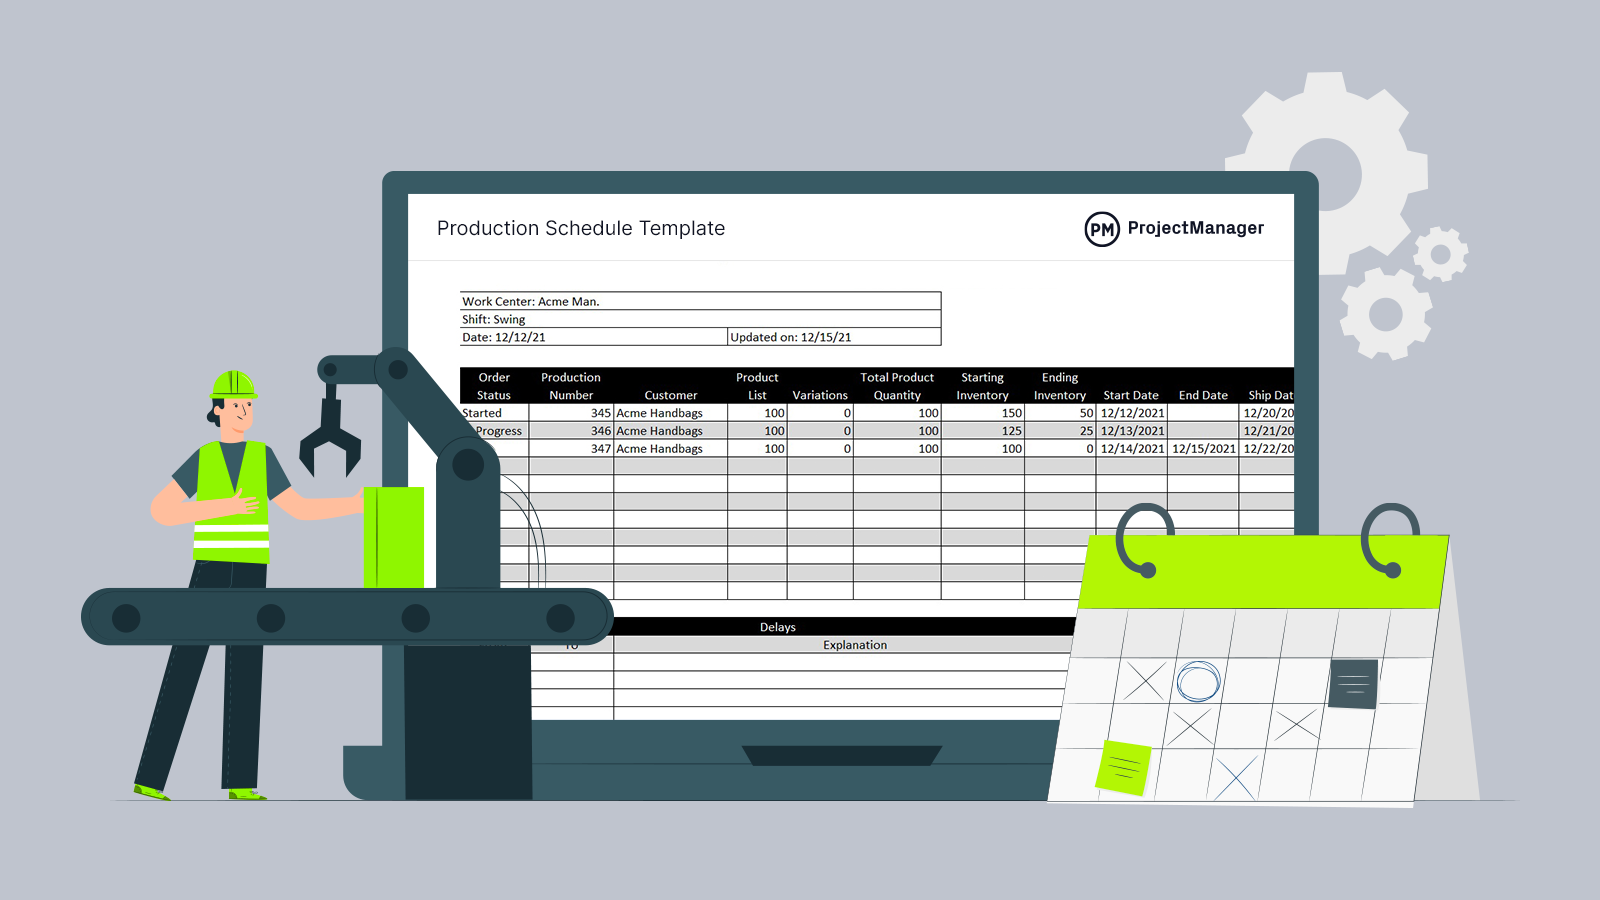
Production Schedule Template
Use this free Production Schedule Template to manage your projects better.
Get the Template
What Is a Production Report?
A production report is a product of the product reporting process. It’s a document that includes manufacturing KPIs that allows organizations to track various aspects of their manufacturing process such as for the production volume that’s manufactured over a specific period.
A production report will also include the production capacity utilization rate, any issues in the production line and how efficiently products are manufactured in terms of time, quality and costs. The main objective of a production report is to provide data that production managers can use for production management and optimization purposes.
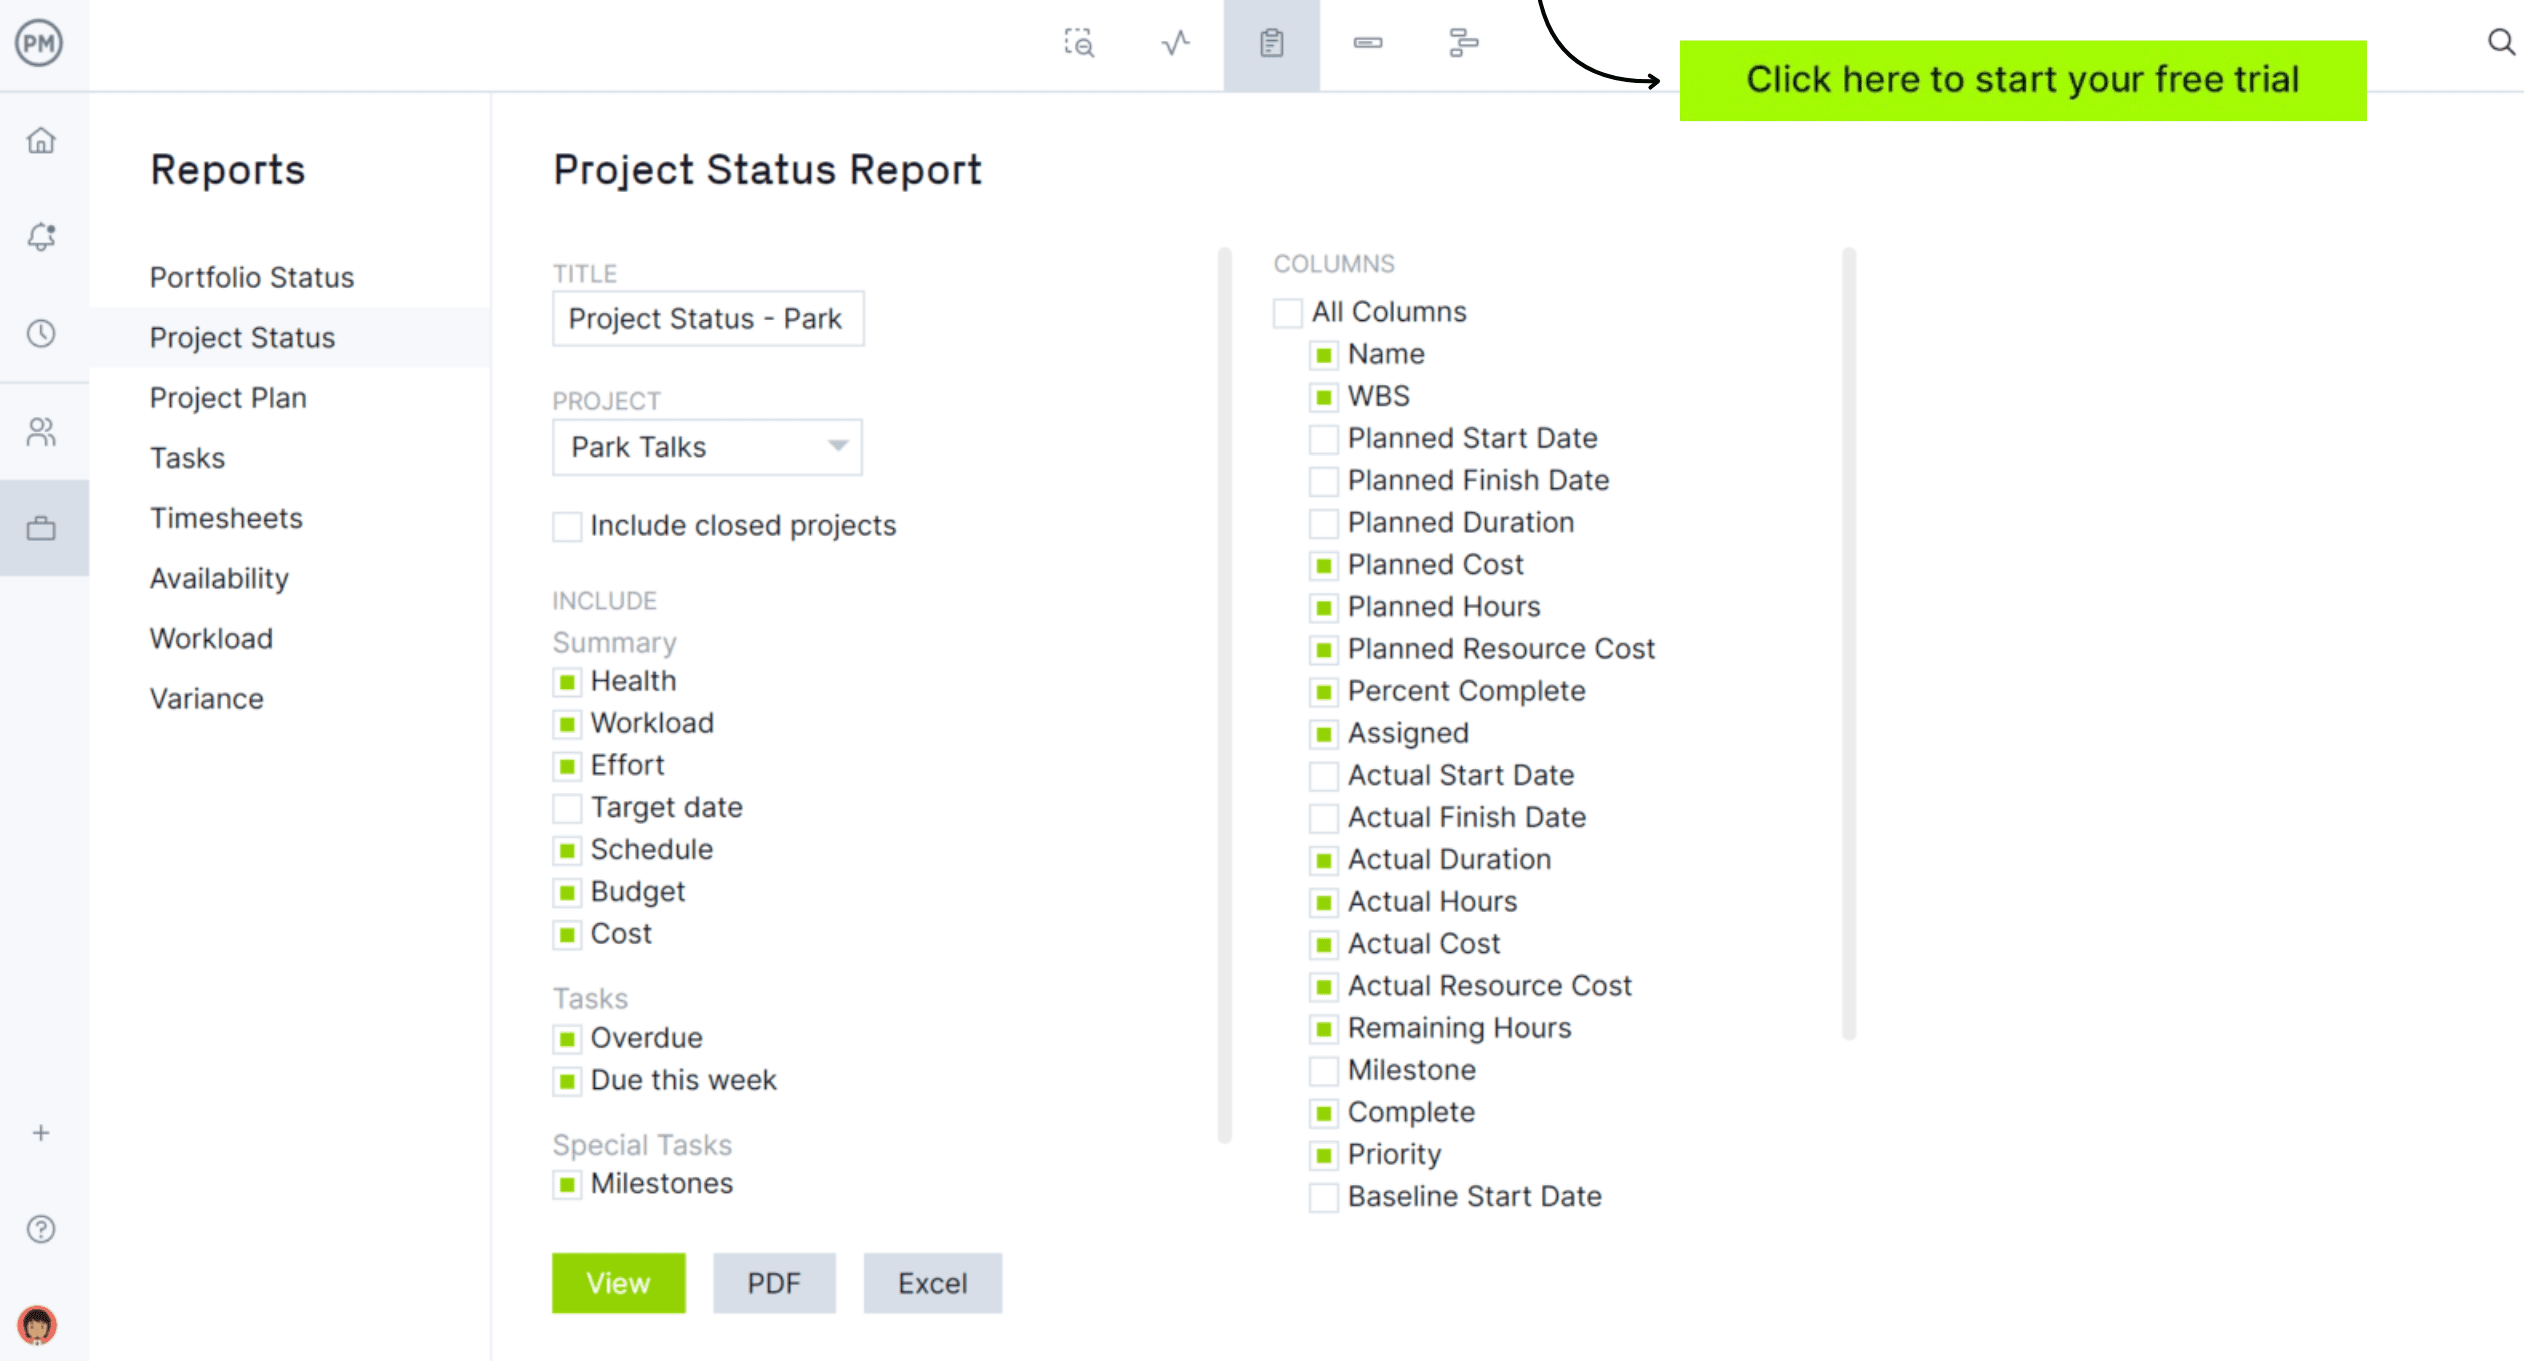
If production managers use project management software, they often have access to reporting features that can assemble this information. ProjectManager is award-winning project and portfolio management software with customizable reports that provide real-time data for more insightful decision-making. Generate status, workload, timesheet, variance and other reports in just a keystroke. All reports can be filtered and shared with stakeholders to keep them updated. Get started with ProjectManager today for free.
Production Report Example Outline
Production managers use the production report to monitor production to increase efficiency. To do this, the production report tracks a number of manufacturing KPIs. While a production report can cover a wide range of metrics, generally, it has a core set of KPIs.
A manufacturing KPI is a metric to understand the efficiency of the production process. It should reflect strategic goals, be quantifiable and measurable, but also attainable and actionable. The following is a project report example of those fundamental manufacturing KPIs that production managers track.
1. Production Efficiency
The overall goal of a production report is to achieve the highest possible efficiency in the processes being executed. That is, the maximum level of production output that can be produced without lowering the quality of the finished goods, increasing their production cost or extending the production schedule. This can be broken down into three main subsets.
- Overall Equipment Effectiveness (OEE): This metric refers to the percentage of time a plant is producing or manufacturing high-quality products as quickly as possible, with no downtime.
- Overall Operations Effectiveness (OOE): Calculates the availability of factory operations from the beginning to the end of the production process.
- Total Effective Equipment Performance (TEEP): This metric gauges resource utilization, such as how the plant is performing in relation to the output it would achieve if it were in operation continuously throughout the year (24/7) and always producing quality products.
2. Production Costs
When reporting on production costs it should include all the expenses that have been incurred from manufacturing a product. That means direct costs, such as raw materials and labor, as well as indirect costs, such as rent and overhead. All of these costs are added up to come up with the total production costs.
3. Production Volume
Production volume measures how many units are manufactured over a specific period. This is a fundamental benchmark for manufacturing efficiency and helps production managers understand the total output the factory can produce. The production volume to be manufactured by an organization should be determined by its production budget.
4. Production Downtime
Production downtime refers to the time a factory’s assembly lines aren’t operating. This covers both planned and unplanned downtime. By reducing the downtime, production managers can increase the productivity of their manufacturing efforts.
5. Work-In-Progress
Work-in-progress (WIP) is the cost of unfinished goods in the manufacturing process. This includes all your production costs such as the costs of direct labor, raw materials and manufacturing overhead. This differs from finished goods, which are products ready to be sold to the consumer.
6. Throughput Rate
The throughput rate measures the volume made over a specific period. This KPI analyzes and compares similar equipment, production lines and manufacturing plants. It’s calculated by dividing the total number of good units produced by the specific time frame.
7. Capacity Utilization
Capacity utilization measures how much of a plant’s production capacity is in use. This helps to determine the efficiency of the plant but also can assess its future growth. To calculate this KPI, divide the total capacity used during a specific period by the total available production capacity. Then multiply that figure by 100.
8. First-Time Right (FTR)
First-time right comes from total quality management (TQM) and Six Sigma, which is a set of methodologies and tools used to improve business processes by reducing defects and errors, minimizing variations and increasing quality and efficiency. It’s a measurement to ensure that activities are performed correctly the first time to avoid the need for rework, which takes time and adds costs to production.
9. Maintenance Costs
Maintenance costs are all the costs related to the activities in your maintenance schedule. This metric helps production managers monitor the performance of a machine over time with the goal of optimizing equipment availability while keeping costs at a minimum. Maintenance unit cost is the total maintenance expenses required to produce one product unit during a specified period. To calculate maintenance costs, divide the total maintenance costs in a specific time frame by the number of products produced during that same time frame.
Free Production Management Templates
Production reports are only one piece of the larger picture that makes up manufacturing and the management of those processes required to create a commodity. Many templates can help throughout the project management process.
ProjectManager has over 100 free project management templates for Excel and Word that can be downloaded right now to help with every project phase. Some templates address several different industries. Below are a few that can be used for production management.
Production Schedule Template
Use this free production schedule template for Excel to make a plan that balances the supply and demand in the production of goods over a period. This flexible template can respond to demand fluctuations and helps avoid inventory stockouts.
Production Capacity Planning Template
Capacity planning helps production managers determine how much production capacity is needed to meet the demand for their products. Use this free production capacity planning template for Excel to help meet the constantly fluctuating demand.
Resource Plan Template
Production reports are tracking efficiency and one way to improve efficiency is by planning resources better. That can be done with our free resource plan template for Excel. It lists all your employees, their departments and hourly rates. It then maps out their schedule on a calendar.
ProjectManager Helps With Production Reporting
Production management templates are only so helpful. Production managers and their teams will soon experience their limitations. They are static documents that require manual updates and are poor collaborative tools. Upgrading to project management software provides greater control over production and, therefore, increases efficiency. ProjectManager is award-winning project and portfolio management software that can help manage resources and monitor costs and more to identify weaknesses and improve efficiency.
Make Production Schedules With Multiple Tools
Before monitoring manufacturing KPIs with a production report, production managers can set the stage for a successful project by making a production schedule. Tasks, resources and costs can be organized on the Gantt chart or sheet view, which is simply a Gantt chart without a timeline. Link all four types of task dependencies to avoid costly delays and, once the schedule is done, capture it by setting a baseline.
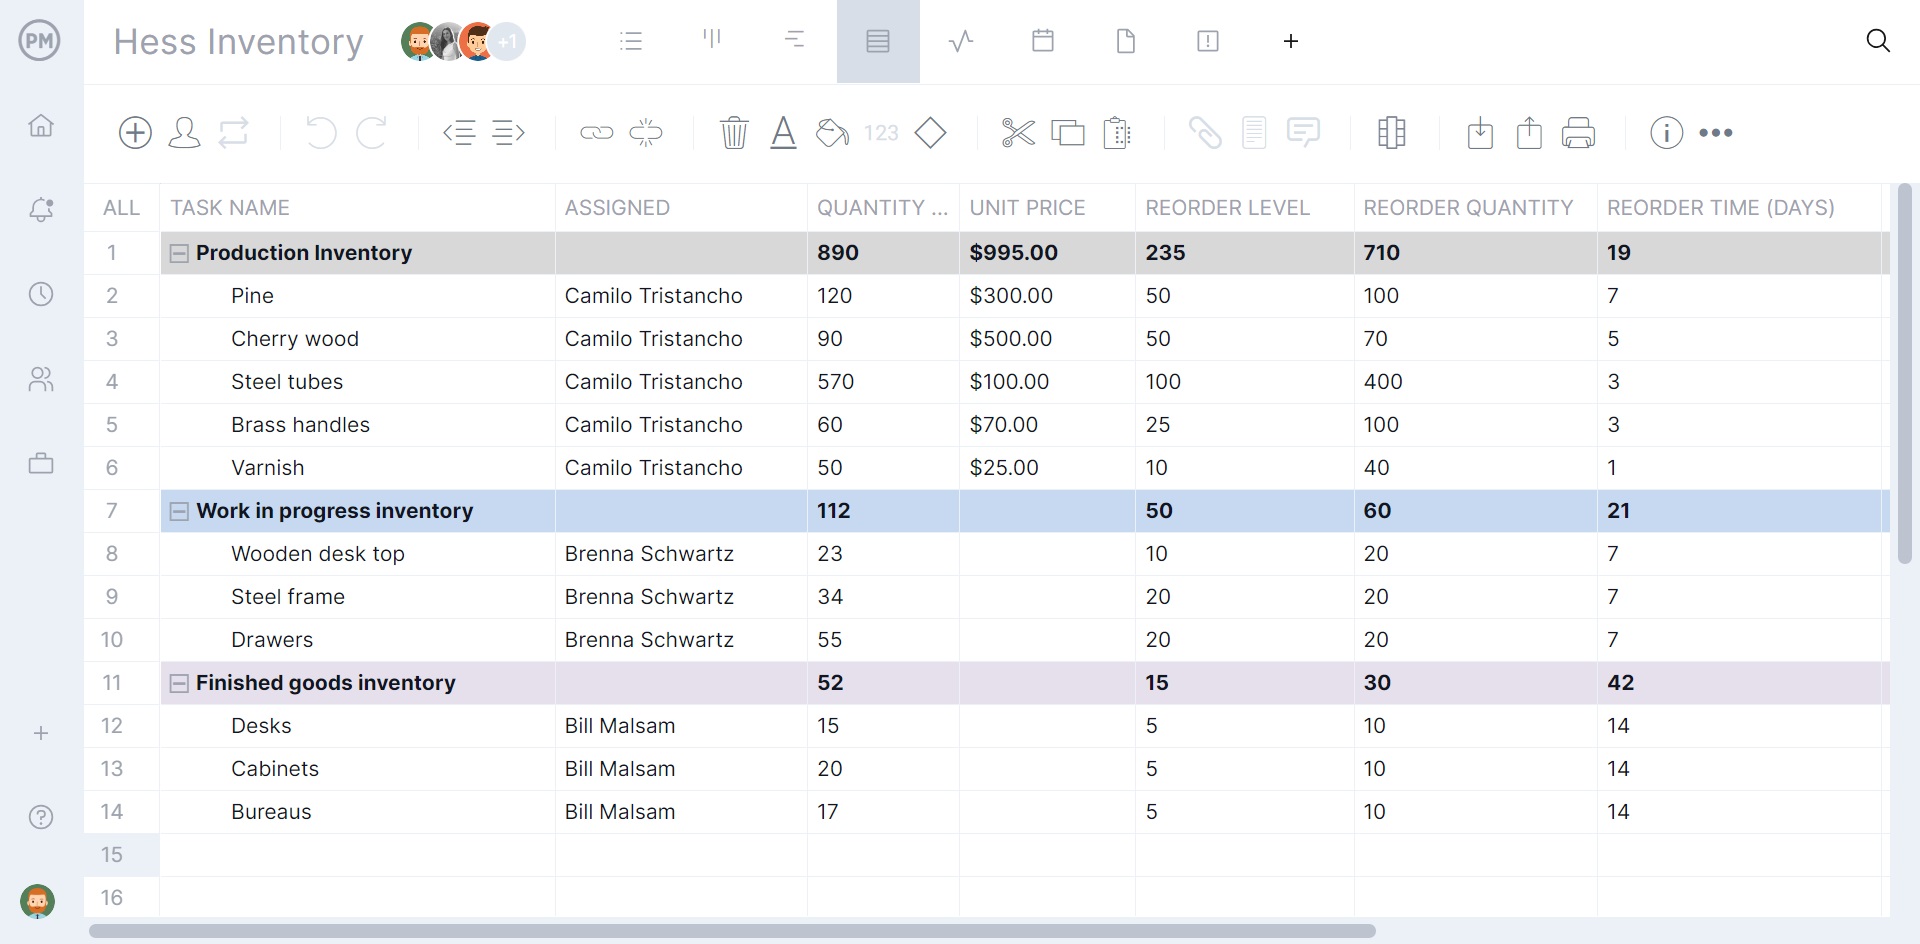
Now production managers can track project variance in real time. Teams don’t need all the bells and whistles of a Gantt chart or sheet view, which is why multiple project views share the schedule and update simultaneously. Track inventory on visual kanban boards and line workers can complete tasks on the list view and stakeholders can get a monthly overview with the calendar view.
Manage Resources & Monitor Production Costs
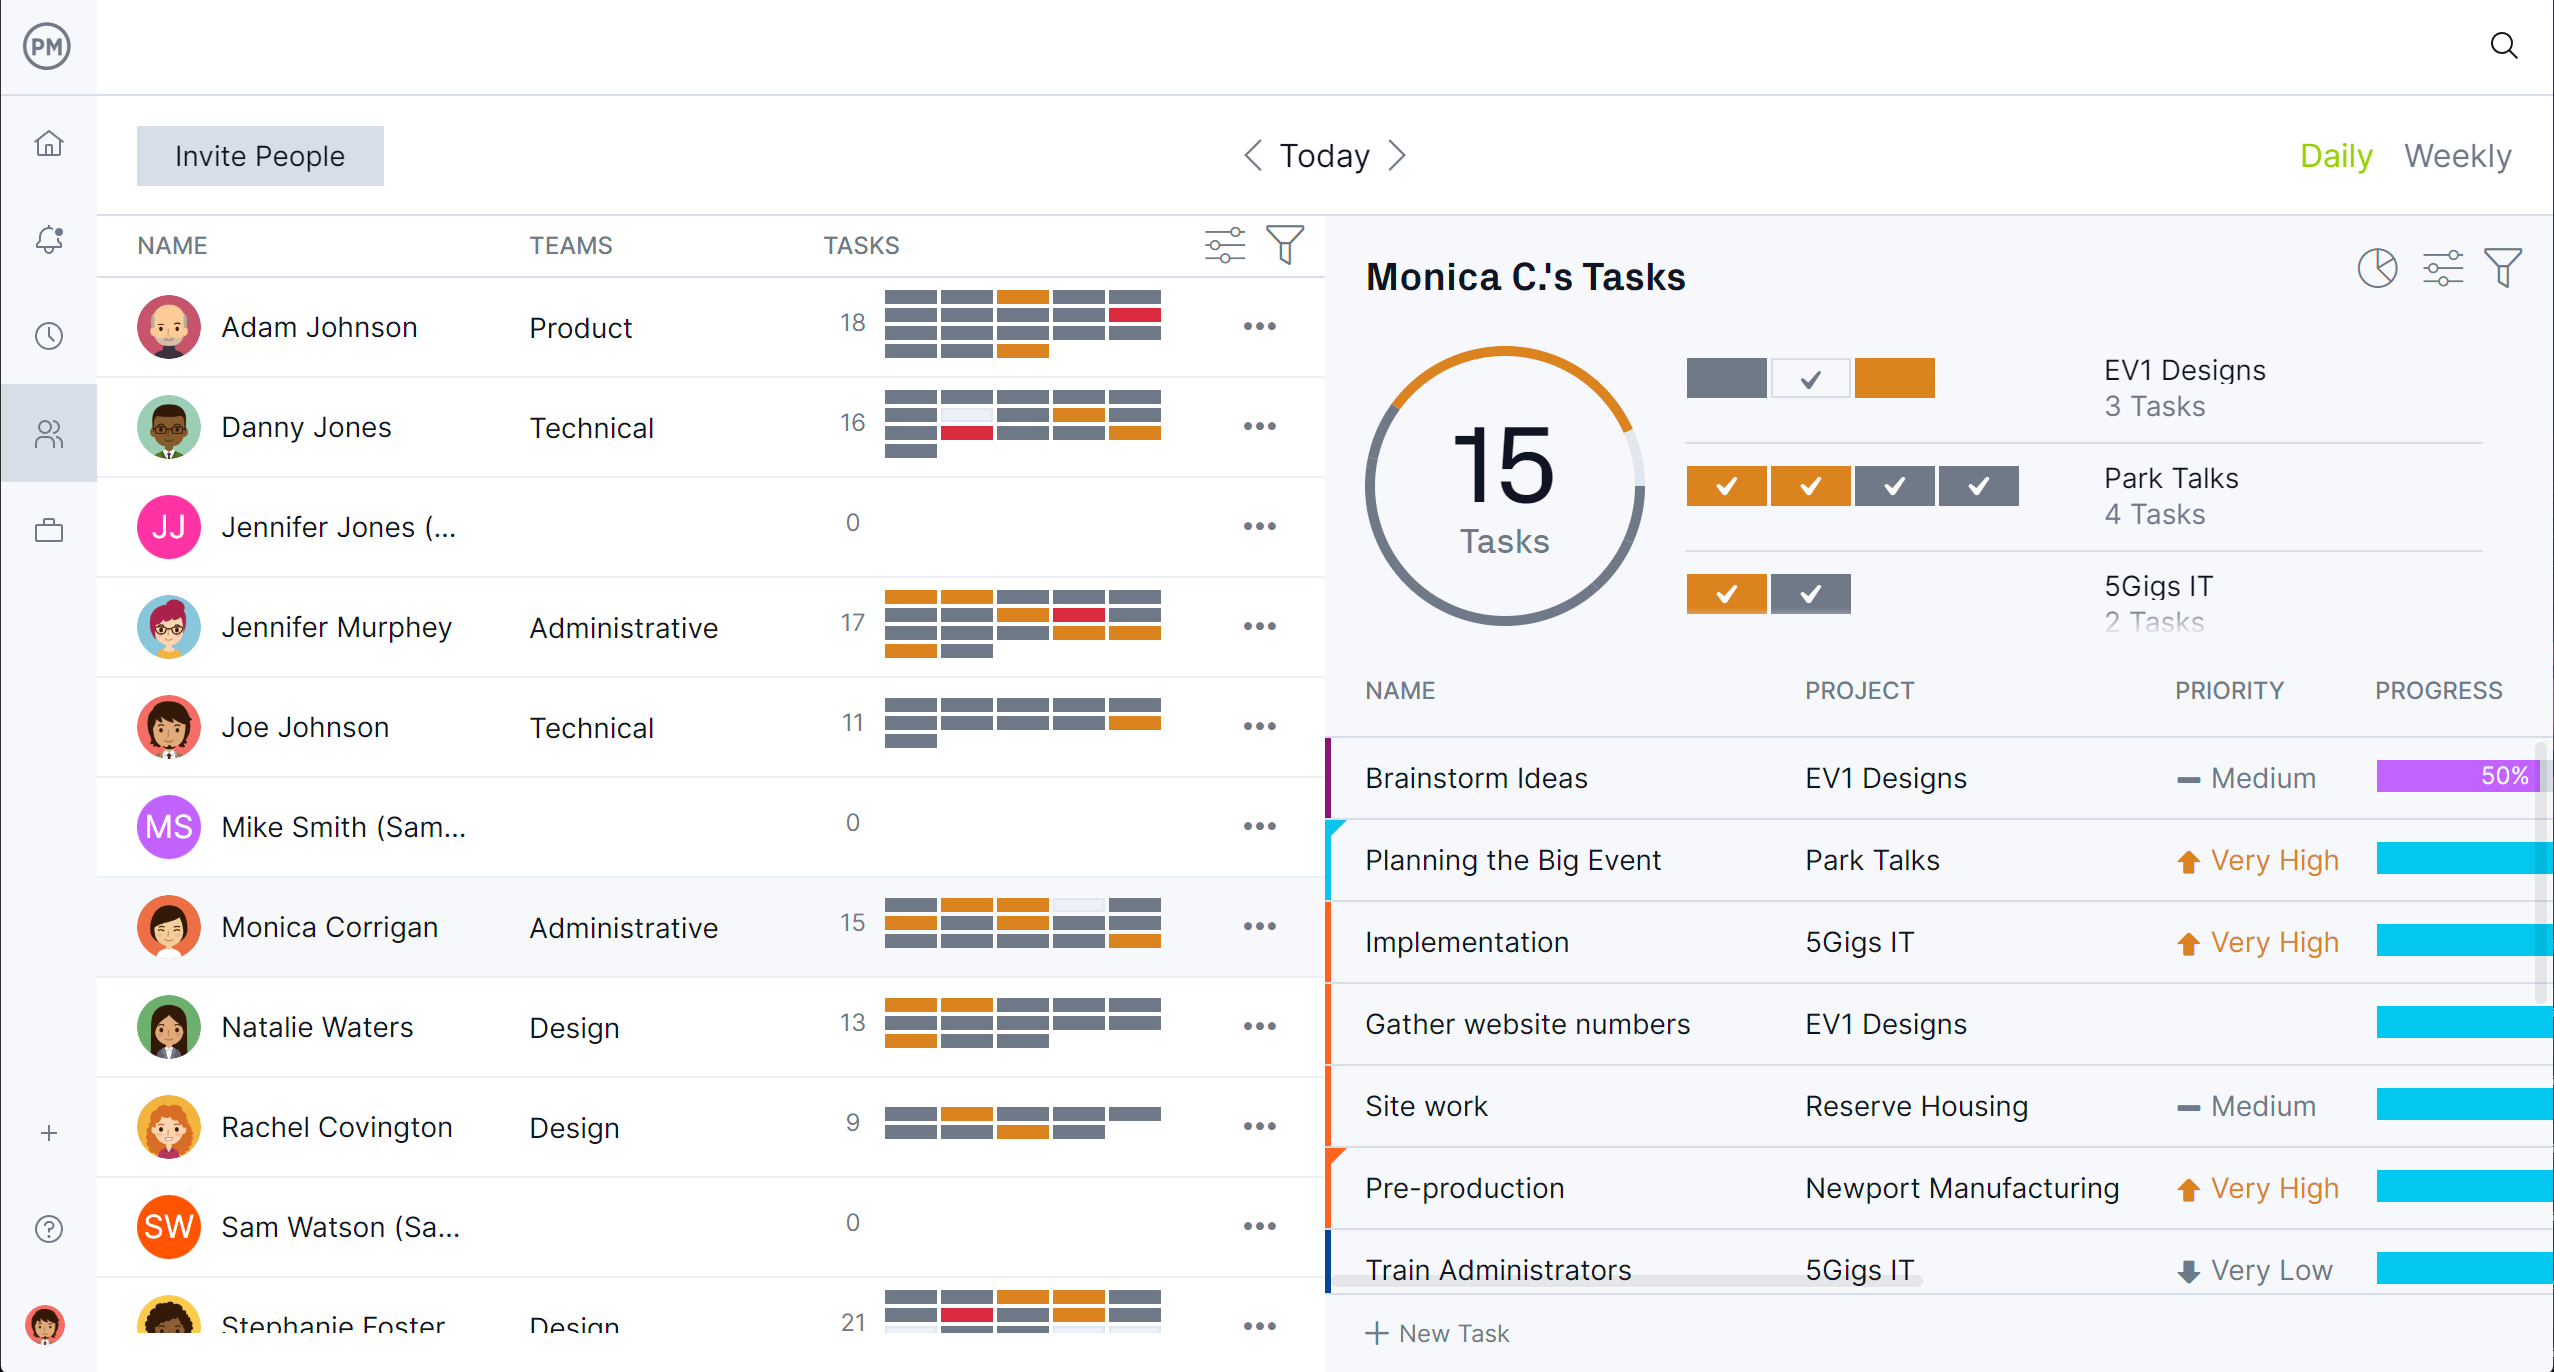
Production reports seek efficiencies and one area that can always be improved is resources. Managing resources starts with the onboarding of employees. At this point, their availability can be set, such as vacation days, PTO and global holidays. This makes it easier to assign them work. Use the team page or color-coded workload chart to see the team’s allocation and balance their workload to keep them working at capacity.
Use our secure timesheets to ensure that labor costs align with the budget. Not only do they streamline payroll, but they provide visibility into how far each team member is in completing their tasks. For a high-level overview of production costs, use the real-time dashboard.
Related Production Management Content
Production reporting is only one part of the larger production management process. For readers who care to go deeper into the subject, our site is an online hub for all things project management. We publish blogs, tutorial videos, free templates and more that address every aspect of managing a project and as it applies to many different industries. Here are a handful of links to stories about production management in manufacturing.
- How to Make a Production Flow Chart for Manufacturing
- Cost of Production: Types of Production Costs
- How to Make a Production Order for Manufacturing
- Production vs. Manufacturing: Key Differences
- How to Calculate Production Capacity: Formula & Examples
- ¿Qué se Debe Incluir en un Reporte de Producción?
- Comment rédiger un rapport de production ?
- Produktionsberichterstattung: Was in einem Produktionsbericht enthalten sein sollte
ProjectManager is online project and portfolio management software that connects teams whether they’re in the office, on the production line or anywhere else. They can share files, comment at the task level and stay updated with email and in-app notifications. Join teams at Avis, Nestle and Siemens who use our software to deliver successful projects. Get started with ProjectManager today for free.
