A balance sheet is a fundamental financial statement that provides a snapshot of an organization’s financial position at a given point in time. It outlines assets, liabilities and equity, helping stakeholders assess financial health, liquidity and solvency. Companies rely on balance sheets for informed decision-making, financial planning and regulatory compliance.
A balance sheet template for Excel streamlines this process by automating calculations and organizing financial data efficiently. This allows businesses to save time, reduce errors and maintain accurate financial records effortlessly.

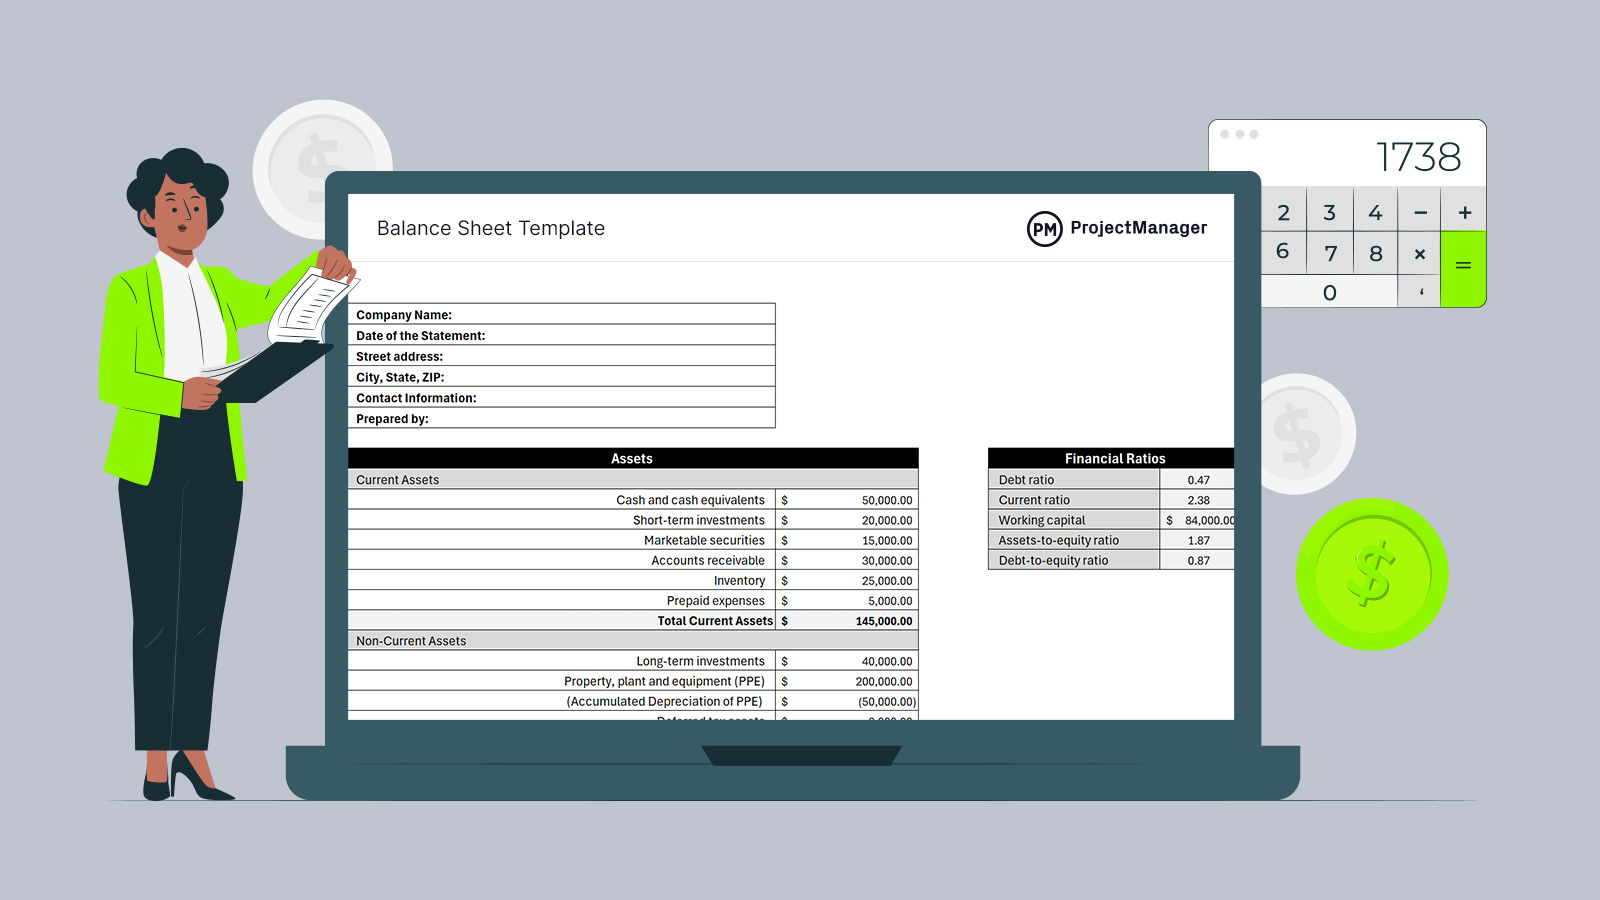
ProjectManager’s free balance sheet template for Excel
Why You Need a Balance Sheet Template
This balance sheet template simplifies financial reporting by performing essential calculations automatically. It sums current and non-current assets, liabilities, and equity, ensuring accurate financial tracking.
Additionally, it computes critical financial ratios, including the debt ratio, current ratio, working capital, assets-to-equity ratio, and debt-to-equity ratio. These metrics provide valuable insights into financial stability, operational efficiency, and risk management, helping businesses make data-driven decisions with ease.
Overall, a balance sheet template is an essential tool for businesses, investors and financial analysts. It provides valuable insights into a company’s financial position, helping drive sound financial decisions and long-term success. Some of those financial decisions will be whether to approve a project or not. If the project is proven to be beneficial to the financial health of the organization, then they’ll need to invest in project management software to deliver that project within its budget.
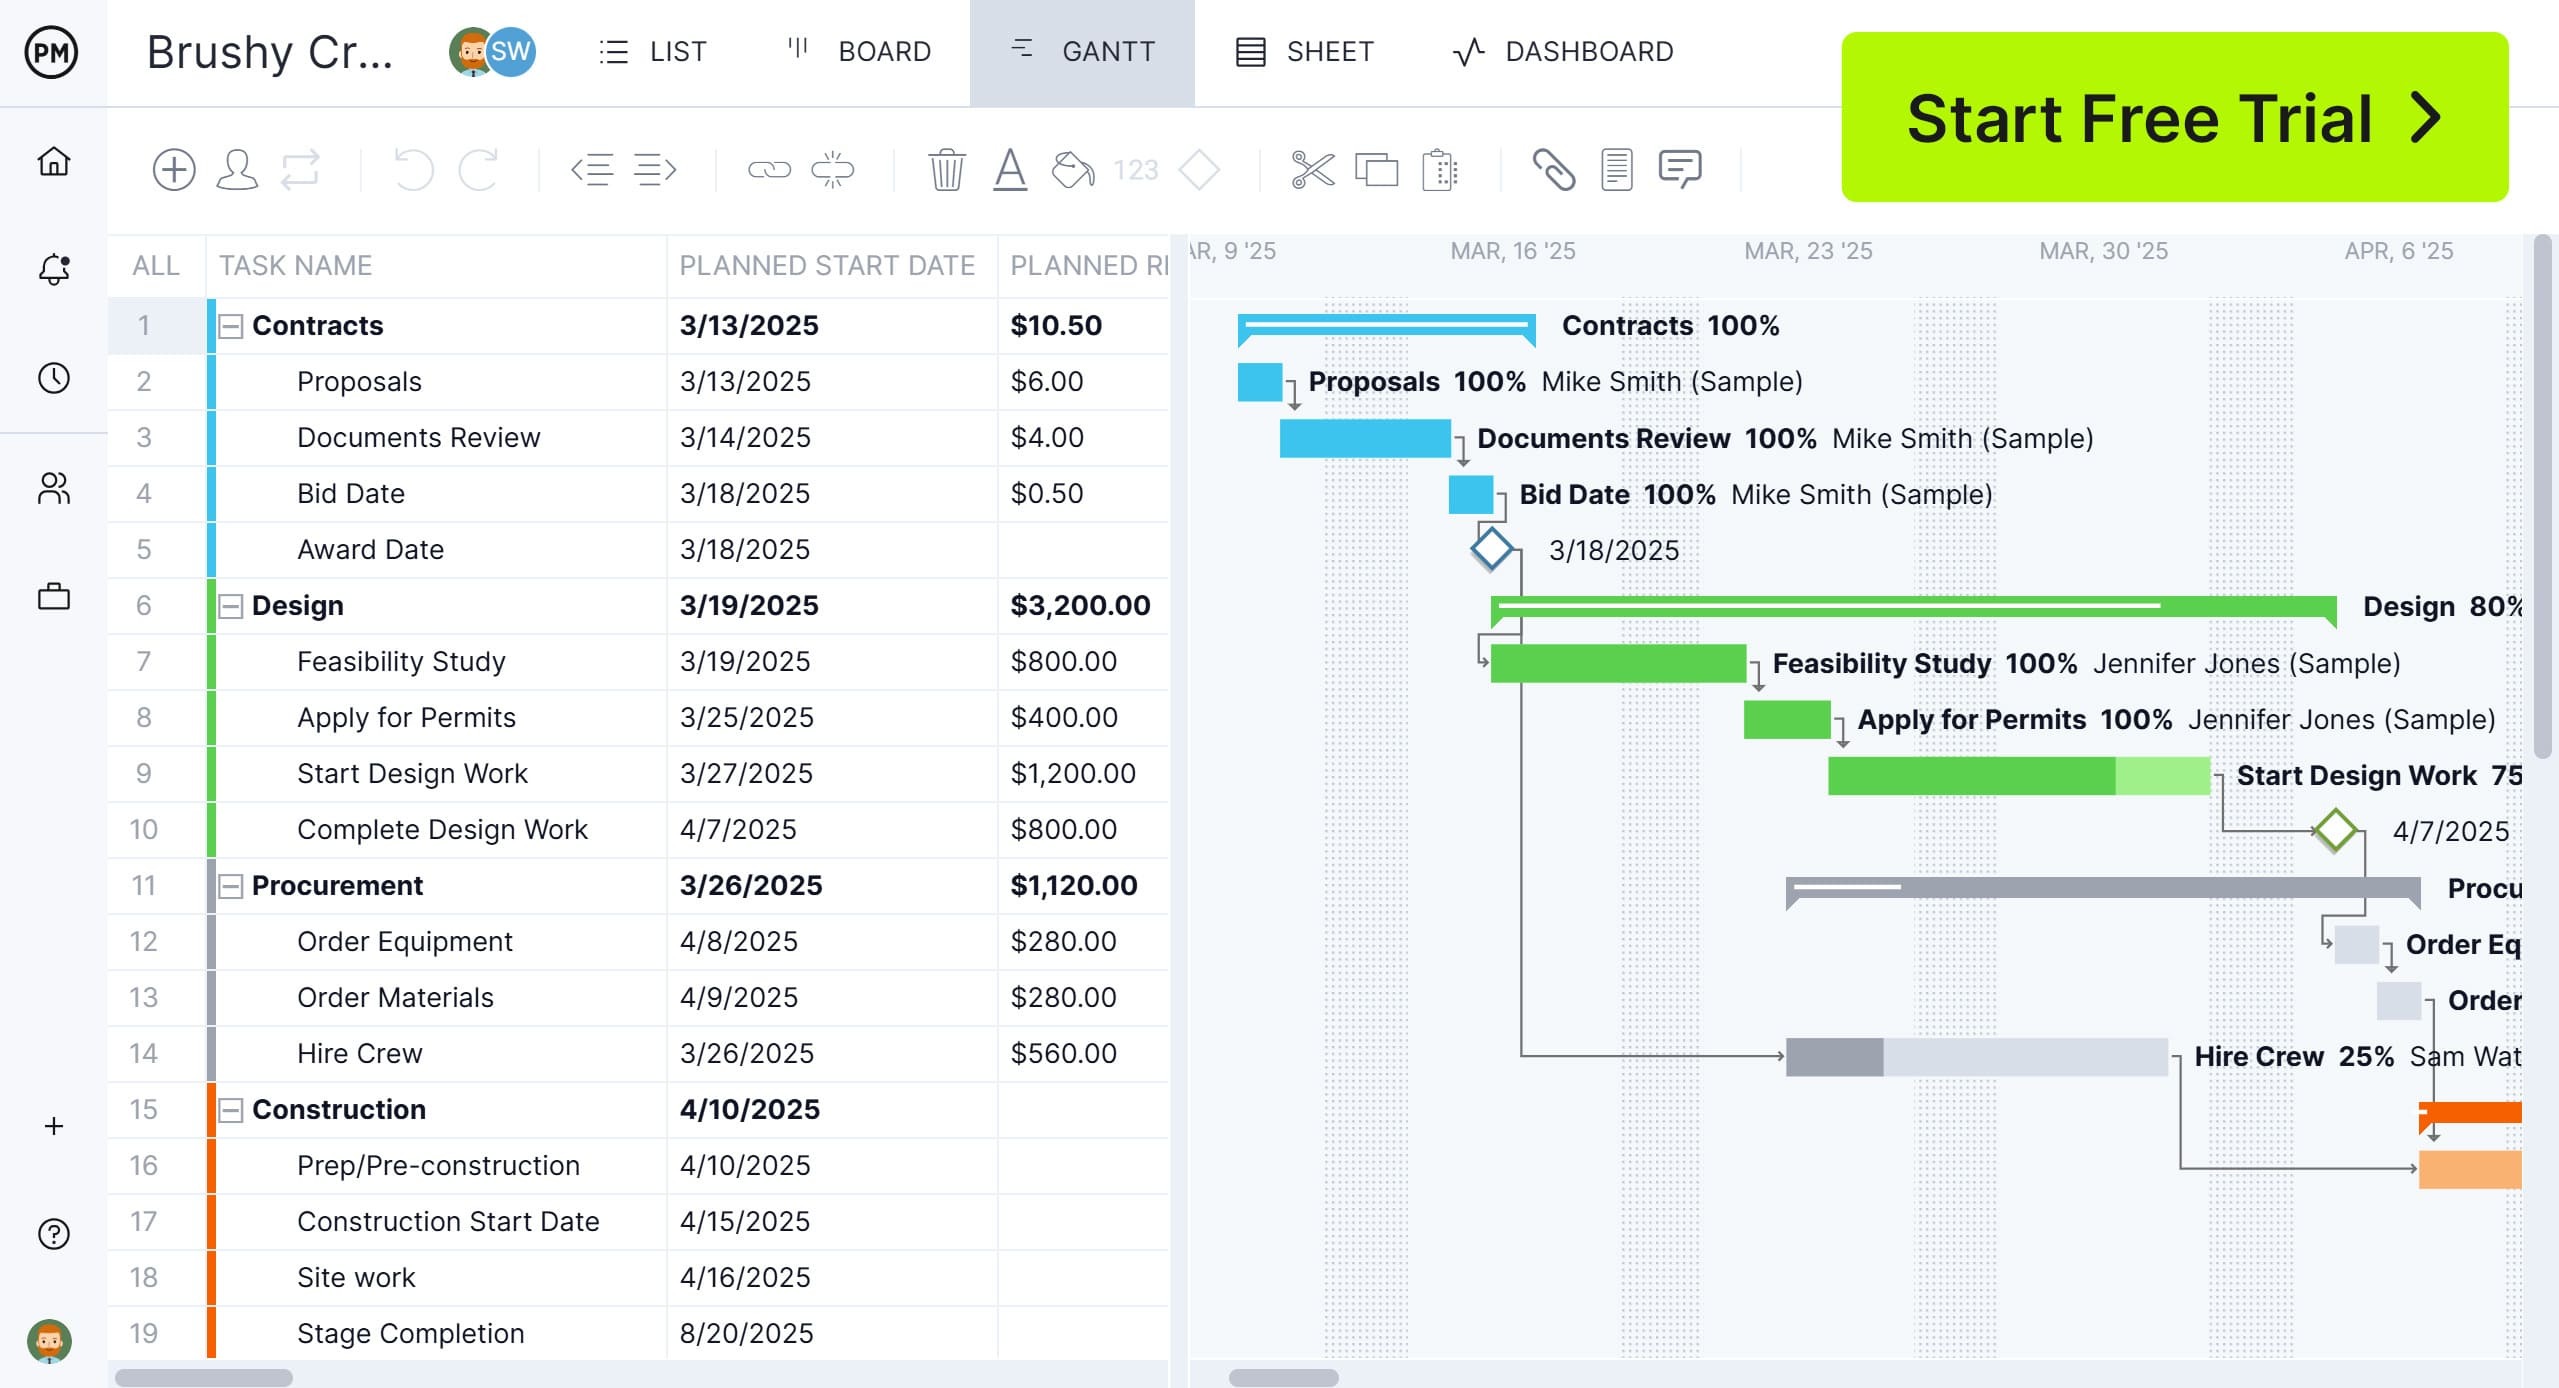
ProjectManager is award-winning project and portfolio management software with robust Gantt charts to schedule project tasks, but also resources and their associated costs. This helps to more accurately forecast the project’s budget and then track those costs as the project is being executed to ensure it stays within budget. The Gantt chart also links task dependencies to avoid costly delays, filters for the critical path to determine slack and sets a baseline to track the actual costs against the planned costs in real time. Get started with ProjectManager today for free.
When to Use This Balance Sheet Template
Organizations use balance sheets to track financial stability, assess risk and make informed strategic decisions. They are essential for investors, creditors and management teams, offering a clear view of a company’s financial standing. This balance sheet template can be used for the following purposes.
- Quarterly reporting: Quarterly balance sheets allow businesses to track financial progress and compare trends over short periods. Investors and stakeholders rely on quarterly reports to evaluate profitability and liquidity to help companies remain on track with their financial goals. It also helps management identify potential cash flow issues early and make necessary adjustments before they escalate.
- Annual reporting: Year-end balance sheets provide a comprehensive overview of an organization’s financial health. These reports are crucial for tax preparation, investor relations and regulatory compliance. By assessing long-term trends, businesses can determine growth patterns, evaluate profitability and make strategic financial decisions. Additionally, shareholders and regulatory bodies often require annual reports.
- Monthly reporting: Monthly balance sheets help businesses maintain consistent financial oversight. This frequent reporting schedule is especially beneficial for startups, small businesses and organizations experiencing rapid changes in financial performance. By reviewing monthly data, companies can identify short-term cash flow fluctuations and ensure they are meeting their financial targets regularly.
- As needed: Certain situations require organizations to prepare a balance sheet outside of their regular reporting schedule. These include applying for business loans, as lenders need to evaluate financial stability before approving funding. Regulatory agencies may also request financial statements for compliance audits. In cases of mergers, acquisitions or investor negotiations, an updated balance sheet demonstrates the company’s financial position.
How to Use This Balance Sheet Template
Now, let’s review the steps that need to be taken to assess the financial health of an organization using this balance sheet template for Excel.
1. Assess the Value of Assets
Assets represent everything a business owns that has economic value and can provide future benefits. They are crucial in determining a company’s financial health, as they reflect the resources available to generate revenue and sustain operations. A well-managed asset portfolio indicates financial stability and growth potential. Assets are categorized into current and non-current assets based on their liquidity and usage timeframe. Current assets are expected to be converted into cash within a year, while non-current assets provide long-term value.

- Cash and cash equivalents: Readily available funds such as cash on hand and short-term liquid investments.
- Short-term investments: Financial assets that can be quickly converted into cash, such as treasury bills or certificates of deposit.
- Marketable securities: Investments in stocks or bonds that can be sold on the open market.
- Accounts receivable: Money owed to the business by customers for goods or services provided on credit.
- Inventory: Goods and materials held for sale or production.
- Prepaid expenses: Payments made in advance for goods or services to be received in the future.
- Long-term investments: Investments in stocks, bonds or other assets held for over a year.
- Property, plant and equipment (PPE): Physical assets such as buildings, machinery and equipment used in operations.
- Accumulated depreciation: The reduction in value of PPE over time due to usage and wear.
- Deferred tax assets: Future tax benefits arising from differences in accounting and tax treatments.
- Intangible assets: Non-physical assets such as patents, trademarks and goodwill.
2. Assess the Value of Liabilities
Liabilities represent the financial obligations a company owes to external parties, such as lenders, suppliers, and employees. They are essential in assessing a company’s financial leverage and ability to meet short- and long-term obligations. A balanced liability structure indicates financial health, ensuring that a business can sustain operations without excessive debt. Liabilities are divided into current liabilities, due within a year and non-current liabilities, which are long-term obligations.

- Accounts payable: Money owed to suppliers for goods or services received but not yet paid.
- Short-term debt: Loans or financial obligations that must be repaid within a year.
- Deferred revenue: Payments received in advance for goods or services yet to be delivered.
- Accrued expenses: Expenses incurred but not yet paid, such as salaries and utilities.
- Income taxes payable: Taxes owed to the government for earnings during a specific period.
- Current portion of long-term debt: The part of long-term loans that must be repaid within the next year.
- Long-term debt: Loans and bonds payable over an extended period, usually beyond one year.
- Deferred tax liabilities: Taxes owed in the future due to temporary differences in accounting and tax reporting.
- Pension obligations: Retirement benefits owed to employees.
3. Measure Stockholders’ Equity
Stockholders’ equity represents the residual interest in a company’s assets after deducting liabilities. It reflects the ownership value and financial strength of a business. A strong equity position indicates financial stability, growth potential and the ability to reinvest in operations. Equity is a critical measure for investors, as it showcases a company’s ability to generate profits and return value to shareholders.

- Common stock: Shares representing ownership and voting rights in a company.
- Preferred stock: Shares that offer fixed dividends but typically no voting rights.
- Retained earnings: Profits reinvested into the company instead of being distributed as dividends.
- Additional paid-in capital: Funds raised from investors above the par value of stock issued.
- Treasury stock: Shares repurchased by the company, reducing the number of outstanding shares.
4. Analyze Financial Ratios
This balance sheet Excel template automatically calculates key financial ratios based on the data entered for assets, liabilities and equity. These ratios help businesses evaluate their financial health and make informed decisions.

- Debt ratio: Measures the proportion of total assets financed by debt. A higher debt ratio indicates higher financial leverage and potential risk.
- Current ratio: Assesses a company’s ability to pay short-term obligations with its current assets. A ratio above 1 suggests good liquidity.
- Working capital: Represents the difference between current assets and current liabilities, indicating a company’s short-term financial health.
- Assets-to-equity ratio: Shows the proportion of a company’s assets funded by shareholders’ equity to help assess financial structure and risk.
- Debt-to-equity ratio: Compares total debt to shareholder equity, indicating the level of financial leverage and risk exposure.
Related Templates
A balance sheet template is only one of the over 100 free project management templates for Excel and Word that help manage every aspect of a project across multiple industries. Below are a few that apply to the financial side of a project or business.
Budget Dashboard
To keep to a budget, whether for a business or a project, requires close monitoring of expenditures. Download our free budget dashboard template for Excel and get a visual representation of direct material, direct labor, direct equipment and more costs.
Operating Budget Template
Use this free operating budget template for Excel to get a detailed look at the coming year or quarter to accurately forecast revenue and expenses over that period. It can also help businesses set goals for the coming year and make them realistic.
Expense Report Template
An expense report records and tracks business-related expenses. Use this free expense report template for Excel to help employees organize receipts, categorize expenses and request reimbursements.
How to Manage Project Costs and Profitability With ProjectManager
Of course, templates are not ideal when managing multiple projects. Project management software is superior for keeping track of project and business costs. ProjectManager is award-winning project and portfolio management software that has multiple project planning, scheduling and tracking tools. We’ve already shown how our Gantt charts can forecast and track budgets, but they can also schedule work. Kanban boards and task lists allow teams to execute that work while tracking their costs. A calendar view allows stakeholders to have a monthly summary of project progress.
Robust Resource Management Keeps Teams Productive
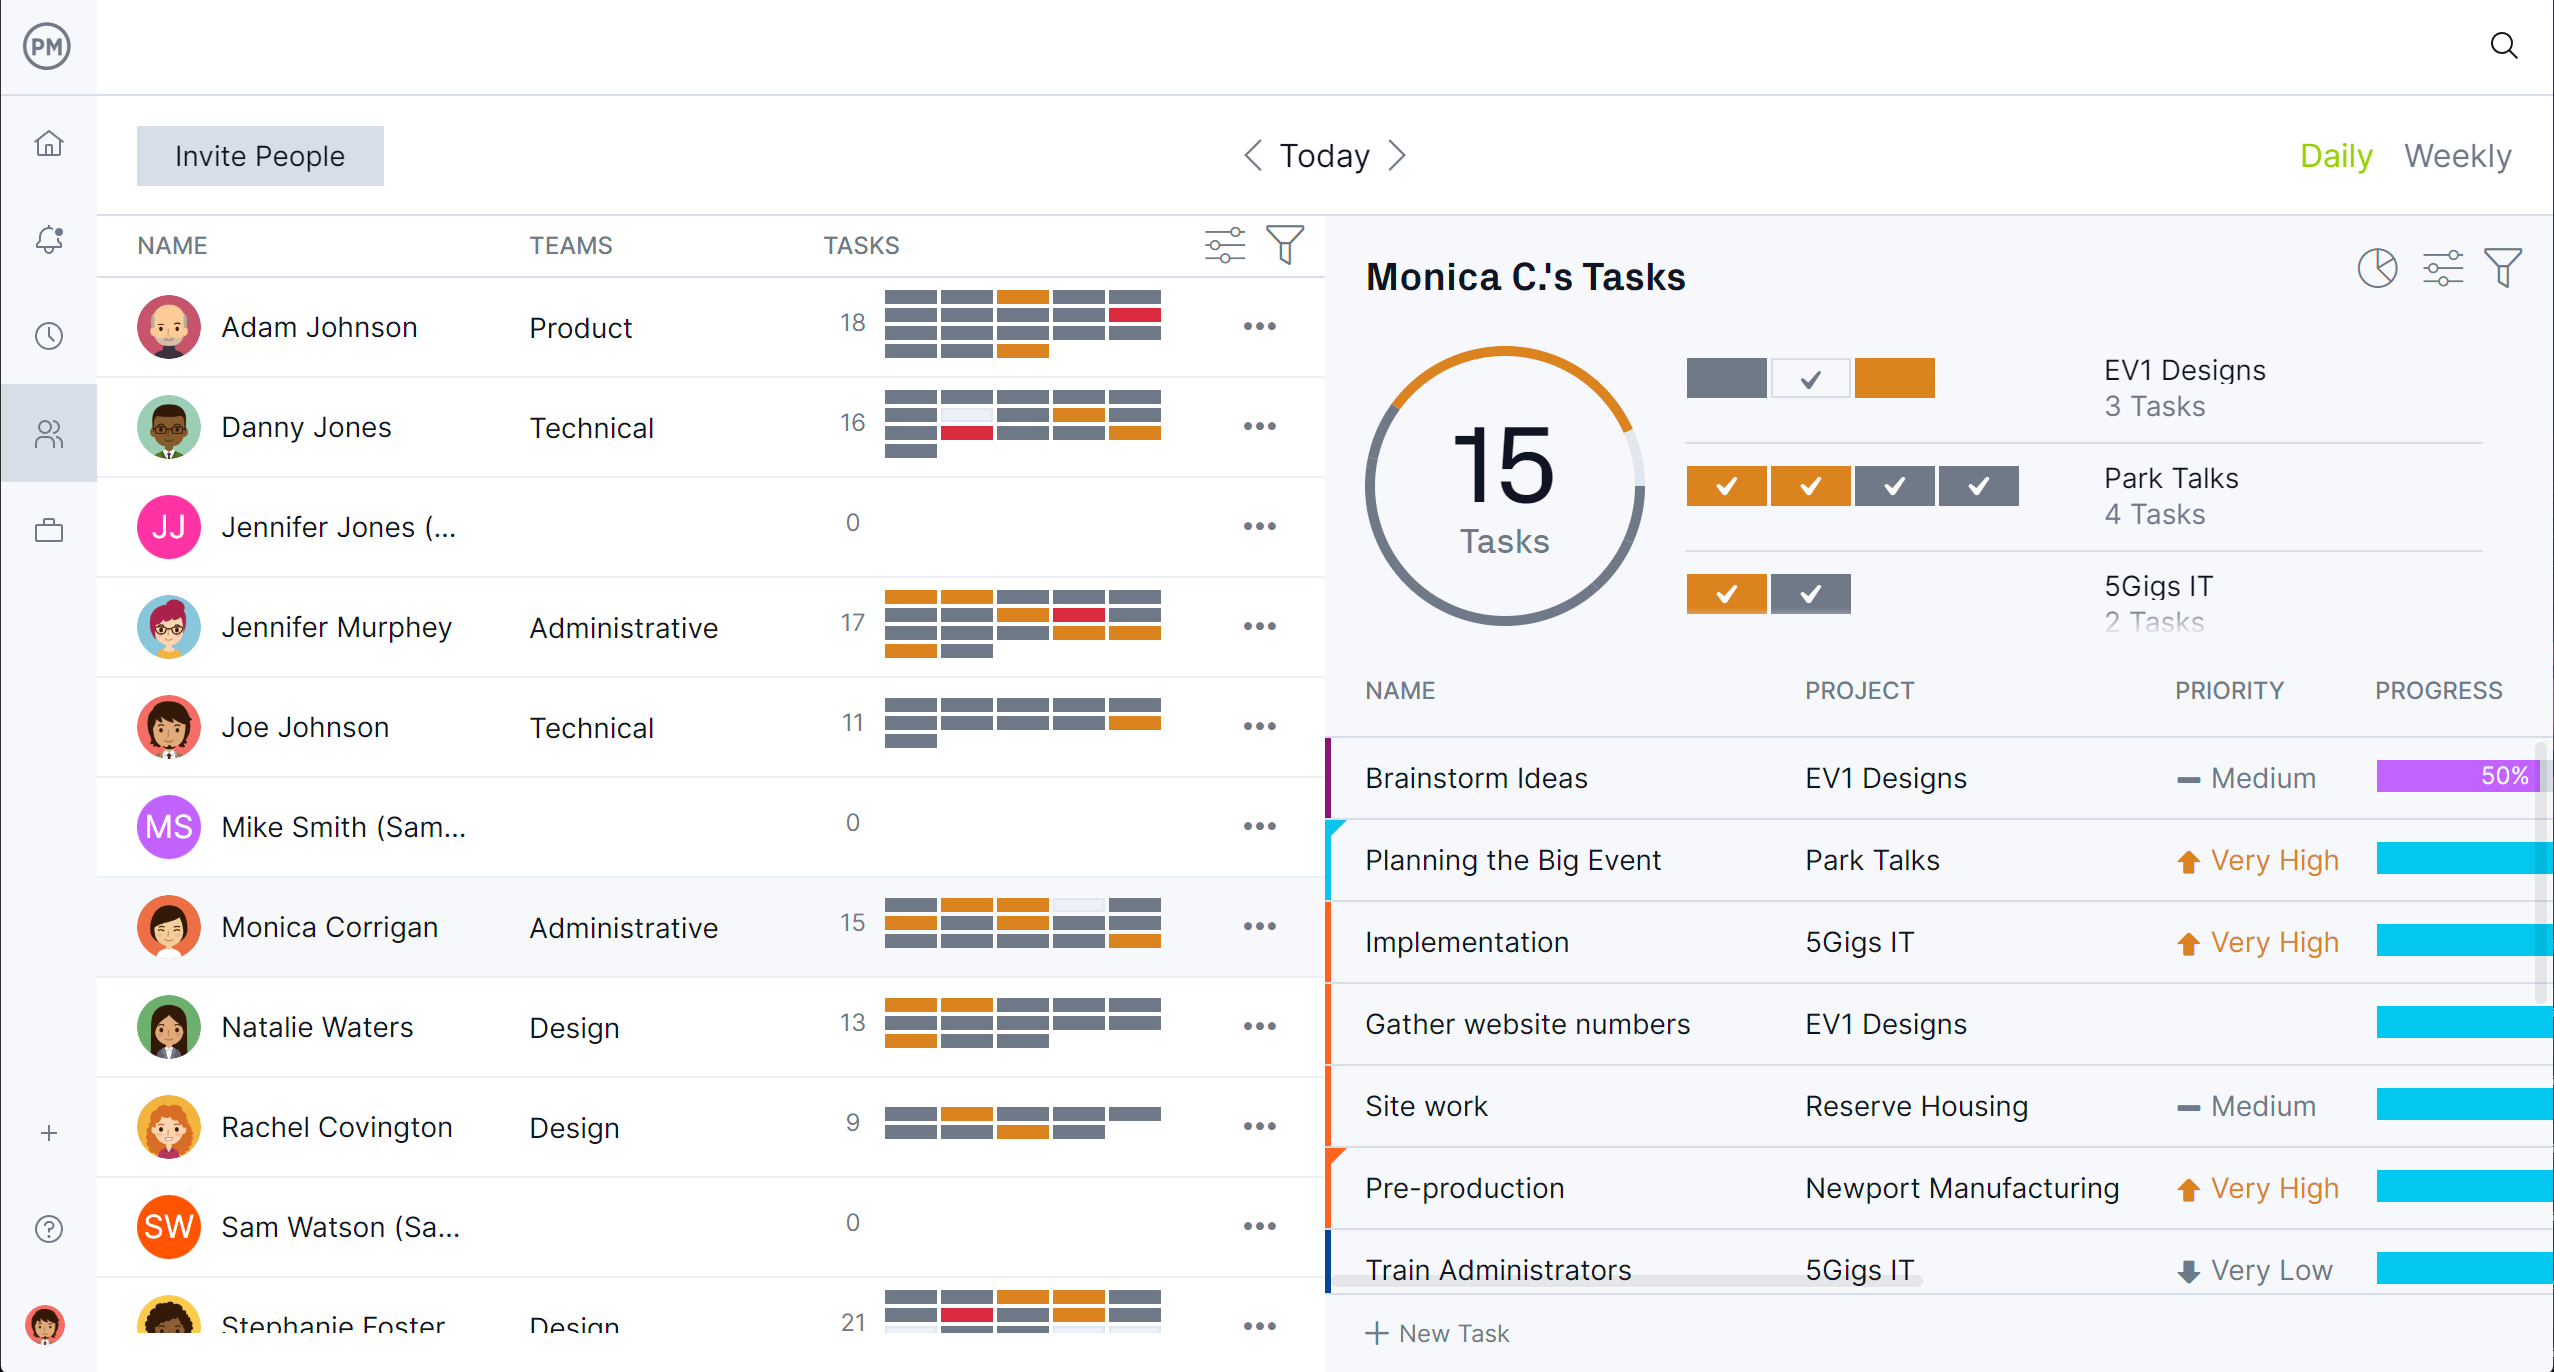
Scheduling human and nonhuman resources on the Gantt chart is only the start of managing those resources. When teams are onboarded, project managers can set their availability to make it easier to know who to assign to what. There’s a color-coded workload chart that provides an overview of resource allocation. Project managers can see who is overallocated or underutilized and balance the team’s workload right from that chart. This keeps everyone working at capacity without worrying about burnout. A team page gives a daily or weekly summary of activities, which can be filtered by progress and priority. Tasks can even be updated from that view.
Monitor Costs and More With Real-time Dashboards and Reports
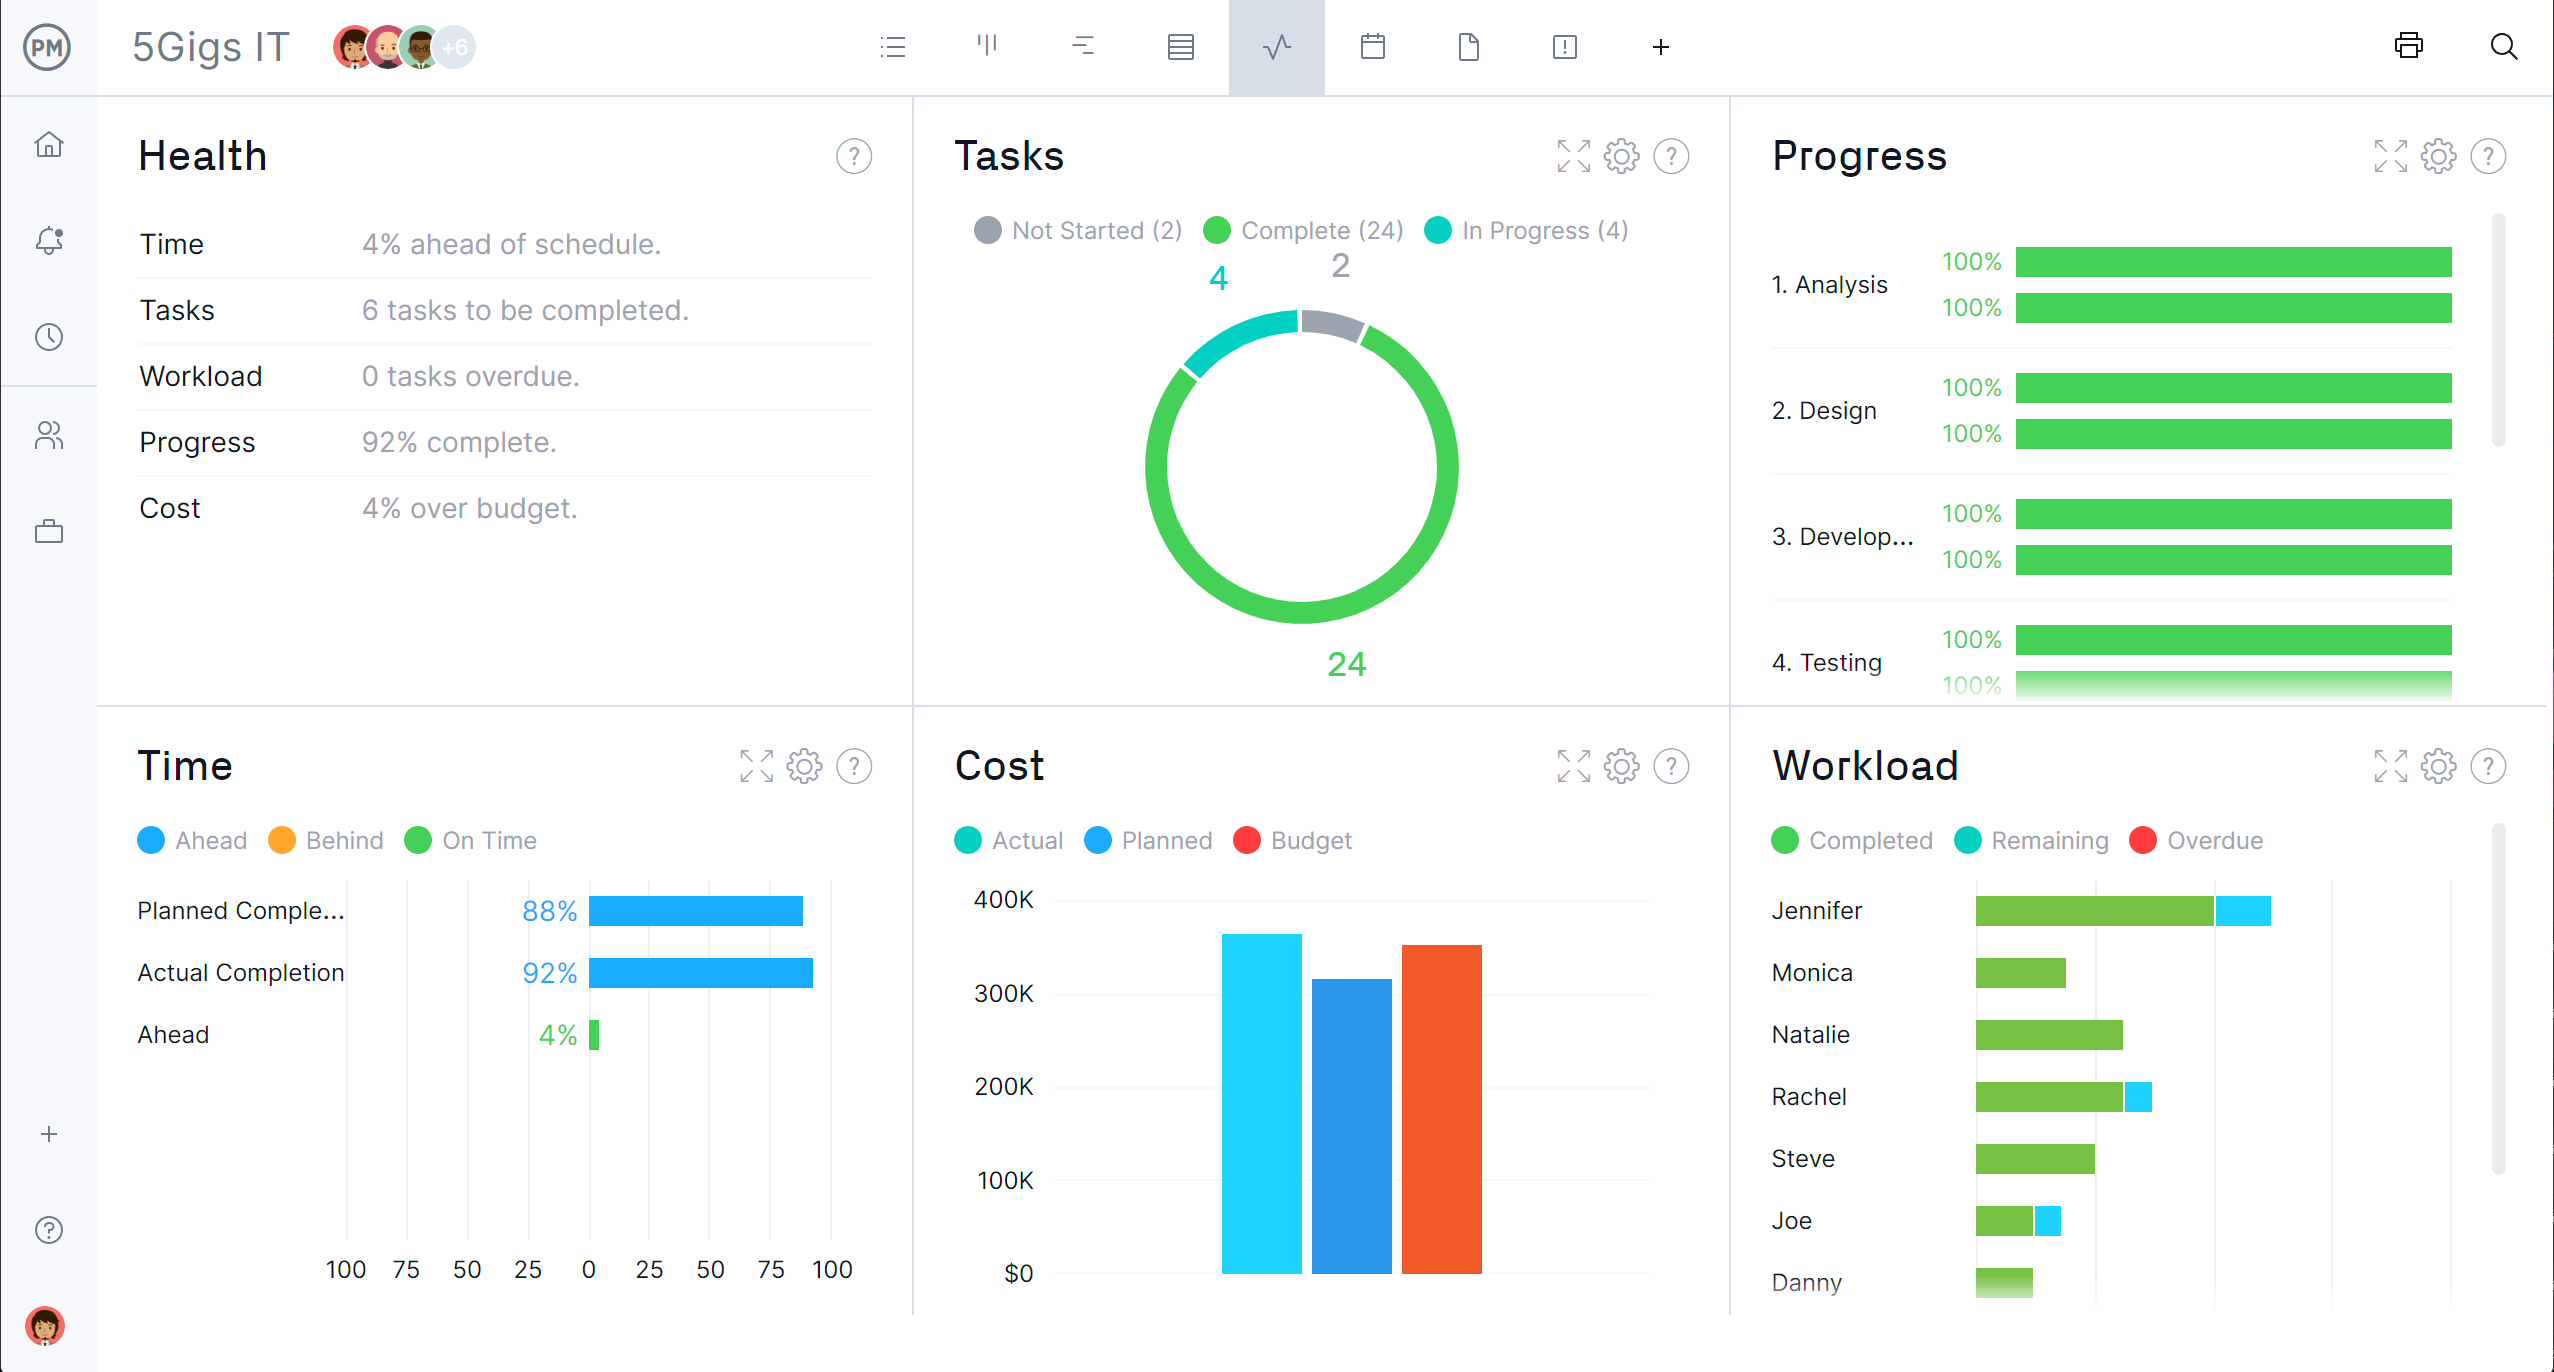
To get a high-level overview of key metrics, toggle over to the real-time project or portfolio dashboards that have easy-to-read graphs and charts that show time, cost, workload and more. The dashboard requires no setup. It’s ready when you are. For more detailed information, use reporting tools that can be generated with a keystroke. See project and portfolio status, variance, workload, timesheets and more. Each report can be filtered to highlight specific data points or provide a more general view of progress to share with stakeholders. Even our secure timesheets help by tracking labor costs to stay on budget.
Related Content
A balance sheet template is part of a larger financial management for a project or a business. Readers who are curious to read more about the subject can visit the handful of links below.
- How to Write a Business Plan
- What Is a Business Budget? Business Budgeting Basics
- Budget Templates for Business & Project Budgeting
- Importance of Scenario Planning and Analysis in Business
- What Is Project Accounting? Principles, Methods & More
- Best Project Management Accounting Software
ProjectManager is online project and portfolio management software that connects teams whether they’re in the office or out in the field. They can share files, comment at the task level and stay updated with email and in-app notifications. Join teams at Avis, Nestle and Siemens who use our software to deliver successful projects. Get started with ProjectManager today for free.