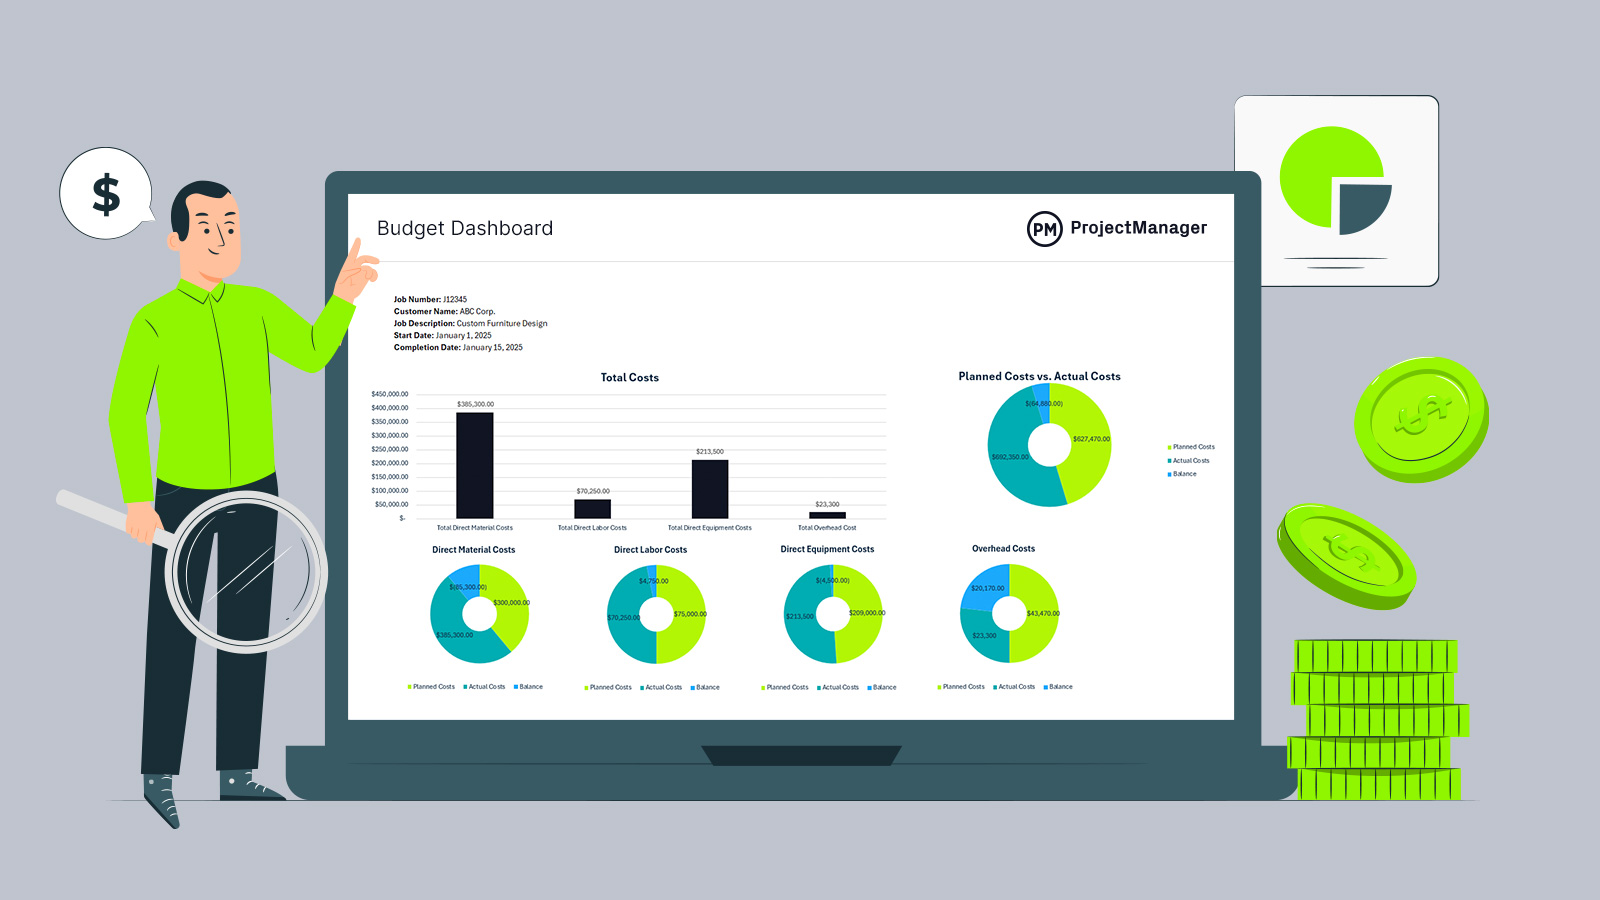
A budget dashboard is essential for managing projects. It provides a visual representation of the project’s financial status, which helps track costs. Use this free budget dashboard for Excel to make quick insights that will lead to more informed decisions about project finances.
What Is a Budget Dashboard?
A budget dashboard is a visual tool that helps track and monitor the financial aspects of a project. It displays key budget-related metrics, such planned vs. actual costs, expenses and forecasts, allowing project managers to quickly assess whether a project is within its financial constraints.
This tool ensures that resources are being allocated efficiently, highlights any potential overspending or delays and aids in making data-driven decisions to keep the project on track financially. That said, an Excel budget dashboard is a poor substitute for dashboard features in project management software, which can provide real-time data.
ProjectManager is award-winning project and portfolio management software with real-time budget dashboards for overseeing individual projects, programs or even a portfolio of projects. Team members can update their statuses anywhere, anytime (even on our mobile app for Android and iOS). This automatically updates the dashboards that track costs, time, workload and more. Get started with ProjectManager today for free.
When to Use a Budget Dashboard
There are many reasons for a budget dashboard in Excel. Let’s focus on two: project management and operations management.
Project Management
The budget dashboard is useful at several key stages in a project. During the initial planning phases, it helps establish a clear financial baseline to ensure the budget aligns with project goals and scope. Once the project is underway, it tracks actual costs against the planned budget, highlighting potential cost overruns.
When facing budget adjustments, a dashboard provides quick insights to support informed decision-making on reallocating resources or adjusting timelines. It also serves as a clear, accessible way to report financial status to stakeholders and upper management.
Operations Management
Here, a budget dashboard helps track resource usage and ensure operational activities are staying within budget, optimizing cost efficiency. It can also monitor ongoing operational costs, identify variances and implement corrective actions quickly if any department exceeds its financial limits.
The budget dashboard can also help forecast future expenses and operational needs, which leads to long-term financial health and sustainability. Regular use can highlight areas of over- or under-spending, allowing for continuous improvements in operational efficiency.
Why Use This Budget Dashboard for Excel?
A budget dashboard offers several key advantages, especially for project managers and operations teams, though they’re better served with project management software. Still, Excel allows for full customization and it can be customized to one’s needs.
Many people are already familiar with Excel, which reduces the learning curve and allows users to quickly set up and manage their dashboards without needing specialized software or training. This is cost-effective, as it’s likely part of a business’s software suite.
Excel allows users to easily import and link data from various sources, such as accounting software or project management tools, enabling them to update the dashboard seamlessly as new data comes in. Of course, this must be done manually and that takes time.
There is flexibility with Excel, depending on one’s comfort with creating formulas, and the files can be shared, though they’re not ideal for collaboration as sharing can lead to numerous versions floating around. However, a budget dashboard is necessary to monitor costs and keep projects within budget.
What Is Included in This Budget Dashboard for Excel?
Once users download the free budget dashboard, they have a fully customizable document. They can add or remove what they want to better align with their interests. Let’s look at what’s included with the download.
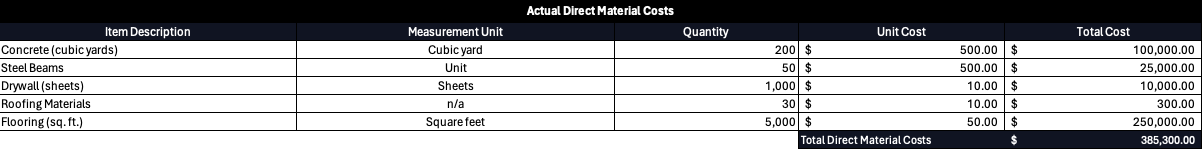
Material Costs
These are the expenses associated with the raw materials or supplies required to complete a project or support operations. These are the costs of tangible goods consumed or used during the production or execution of a project. The budget dashboard includes the following.
- Item Description & Measurement Unit
- Quantity
- Unit Costs
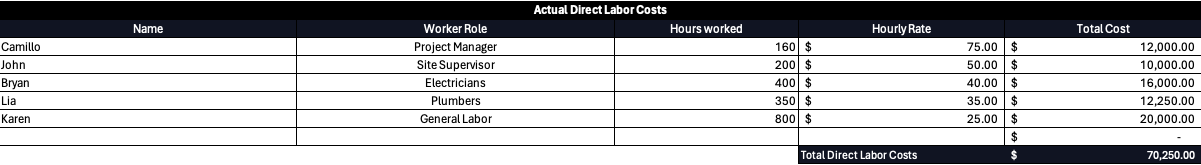
Labor Costs
This refers to the expenses associated with the work performed by employees or contractors to complete a project or maintain operations. These costs typically include salaries and wages, overtime pay, contractor and freelancer fees, benefits, payroll taxes and training and development costs. For this section, fill out the following.
- Worker Name
- Worker Role
- Hours Worked
- Hourly Rate
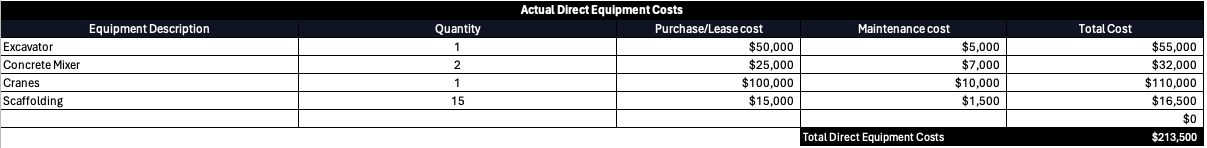
Equipment Costs
Equipment costs are the expenses related to acquiring, maintaining and operating machinery, tools or other physical assets required for a project or operation. These costs typically include purchase, rental, maintenance and repair, depreciation and operating costs. Users will fill in the following table.
- Equipment Description
- Quantity
- Purchase or Lease Cost
- Maintenance Cost
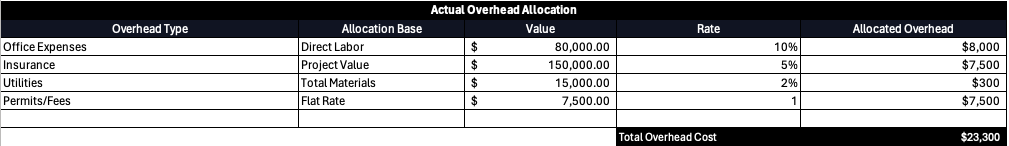
Overhead Costs
These are the indirect expenses that are necessary to support the project or operation but are not directly tied to a specific task or activity. These costs are typically fixed or semi-variable and are spread across the entire project or business, such as rent or lease payments, utilities, administrative costs, insurance, office supplies and equipment and professional fees. Fill out the following.
- Overhead Type
- Allocation Base
- Overhead Allocation Rate
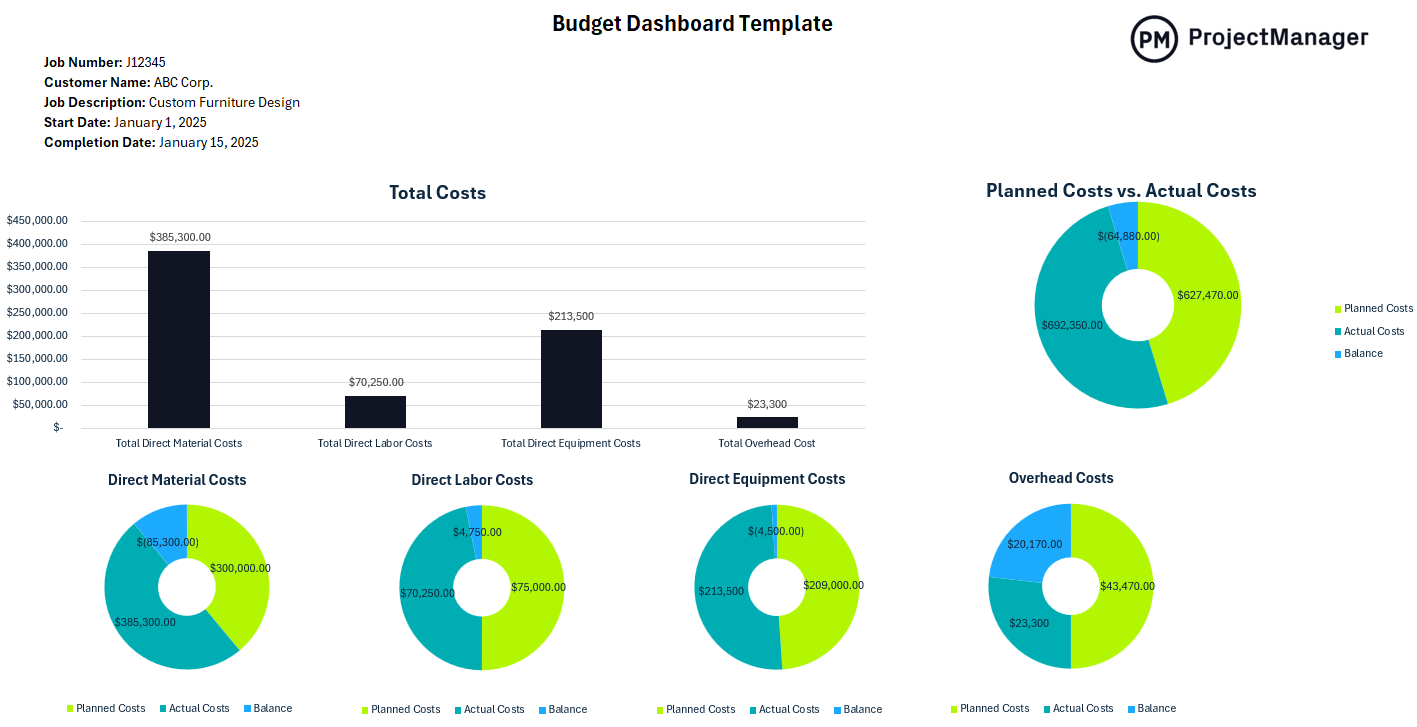
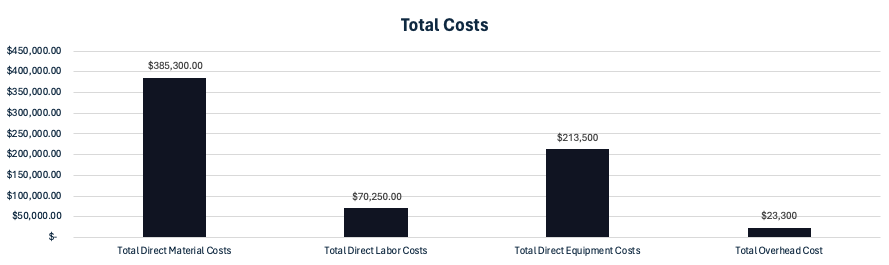
Total Costs Chart
All this data will feed into the total costs cart to provide a snapshot of the financial situation.
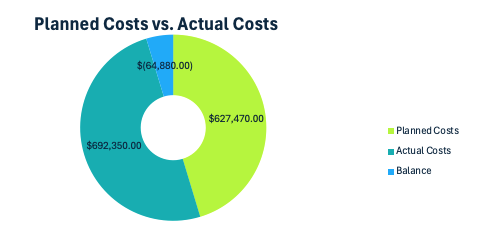
Planned Costs vs. Actual Costs Chart
This pie graph is color-coded to show how much was planned, what the actual costs are and the balance.
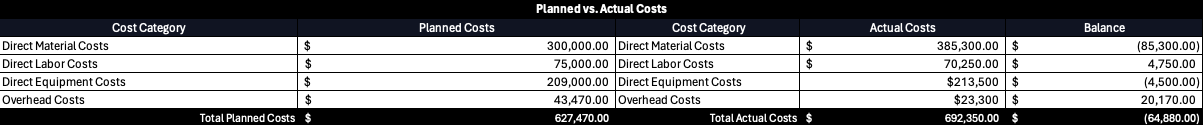
Planned Costs vs. Actual Costs Breakdown
This chart feeds into the pie graph but provides a more detailed breakdown of those costs.
How to Create a Budget Dashboard With ProjectManager
If all this sounds great, it is. However, there are issues with using an Excel budget dashboard. Remember, Excel spreadsheets require a lot from users. These numbers aren’t gathered automatically, like with project management software. The user has to manually input that data, which is not only time-consuming but not accurate as things change quickly. Let’s see how ProjectManager’s budget dashboard improves upon Excel by creating one in the software, which just means starting a free 30-day trial, no credit card required.
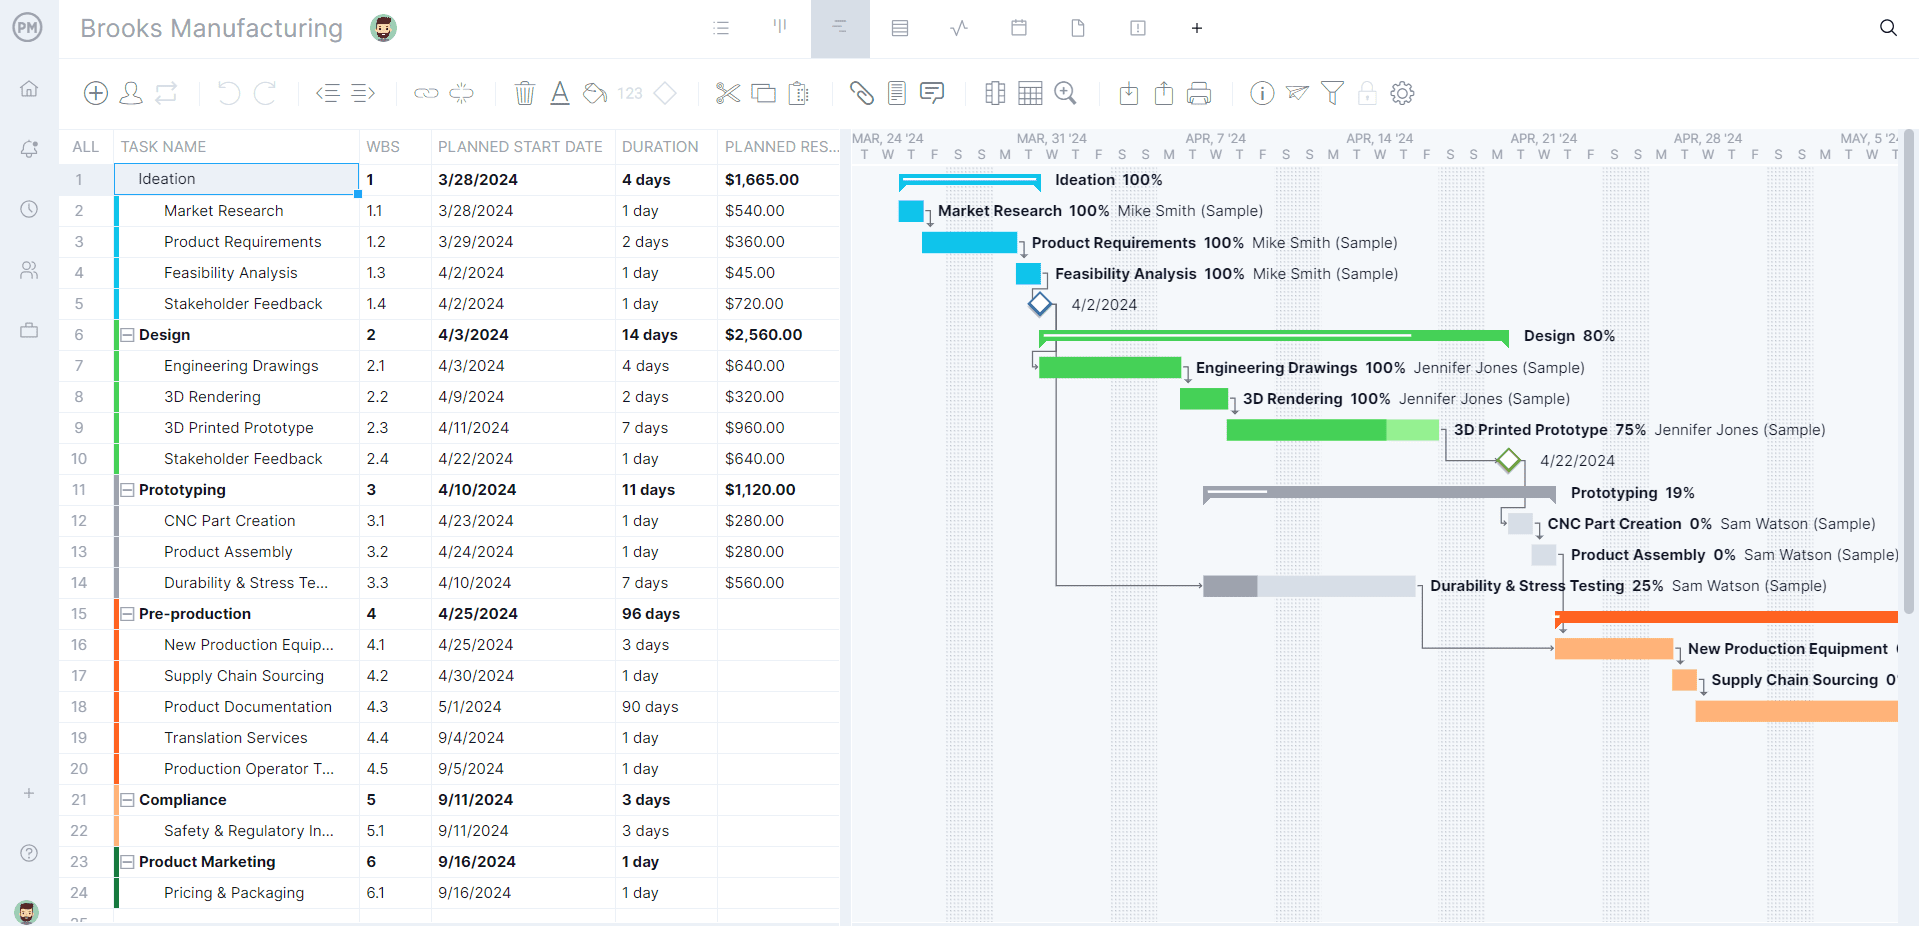
1. Open the Gantt Chart View
Once a project is created, including a budget, toggle to the Gantt chart view, which is one of the multiple project views available on our software. The others are the sheet view (like a Gantt chart, but without the timeline), kanban board, task list and calendar view.
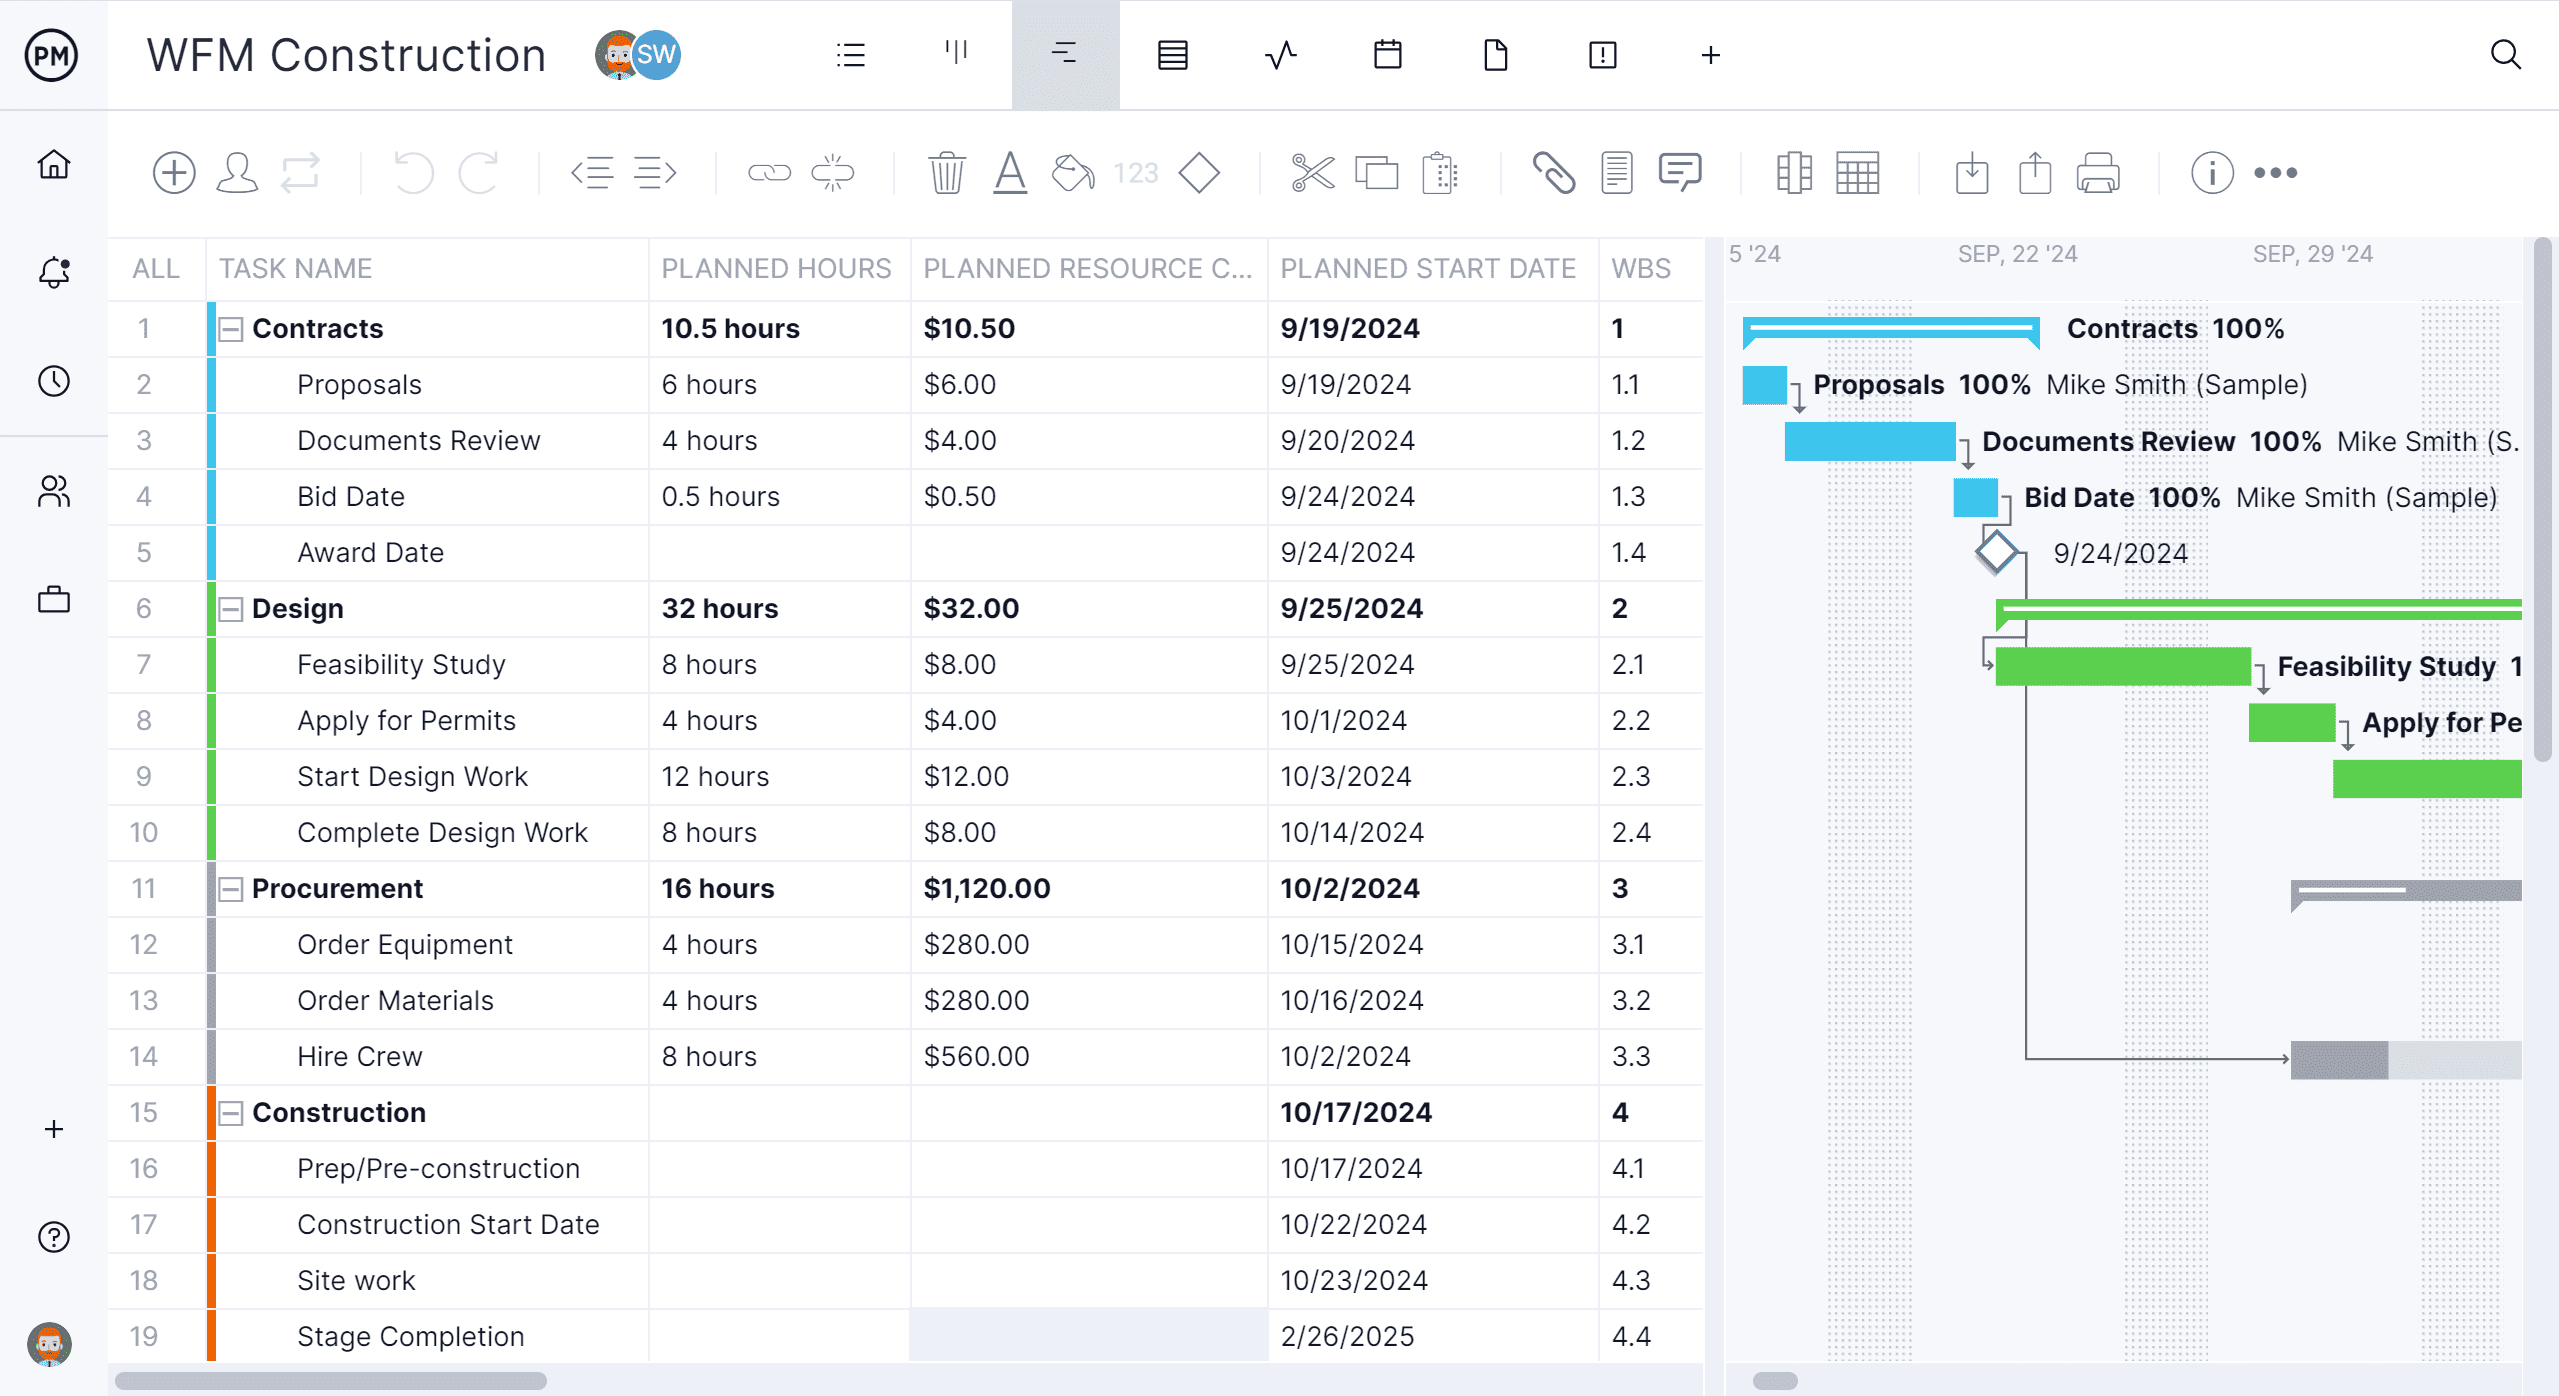
2. List Tasks
At this point, users can manually add the tasks to the Gantt chart or they can import them. Our software will allow users to import Excel spreadsheets, CSV and Microsoft Project files.
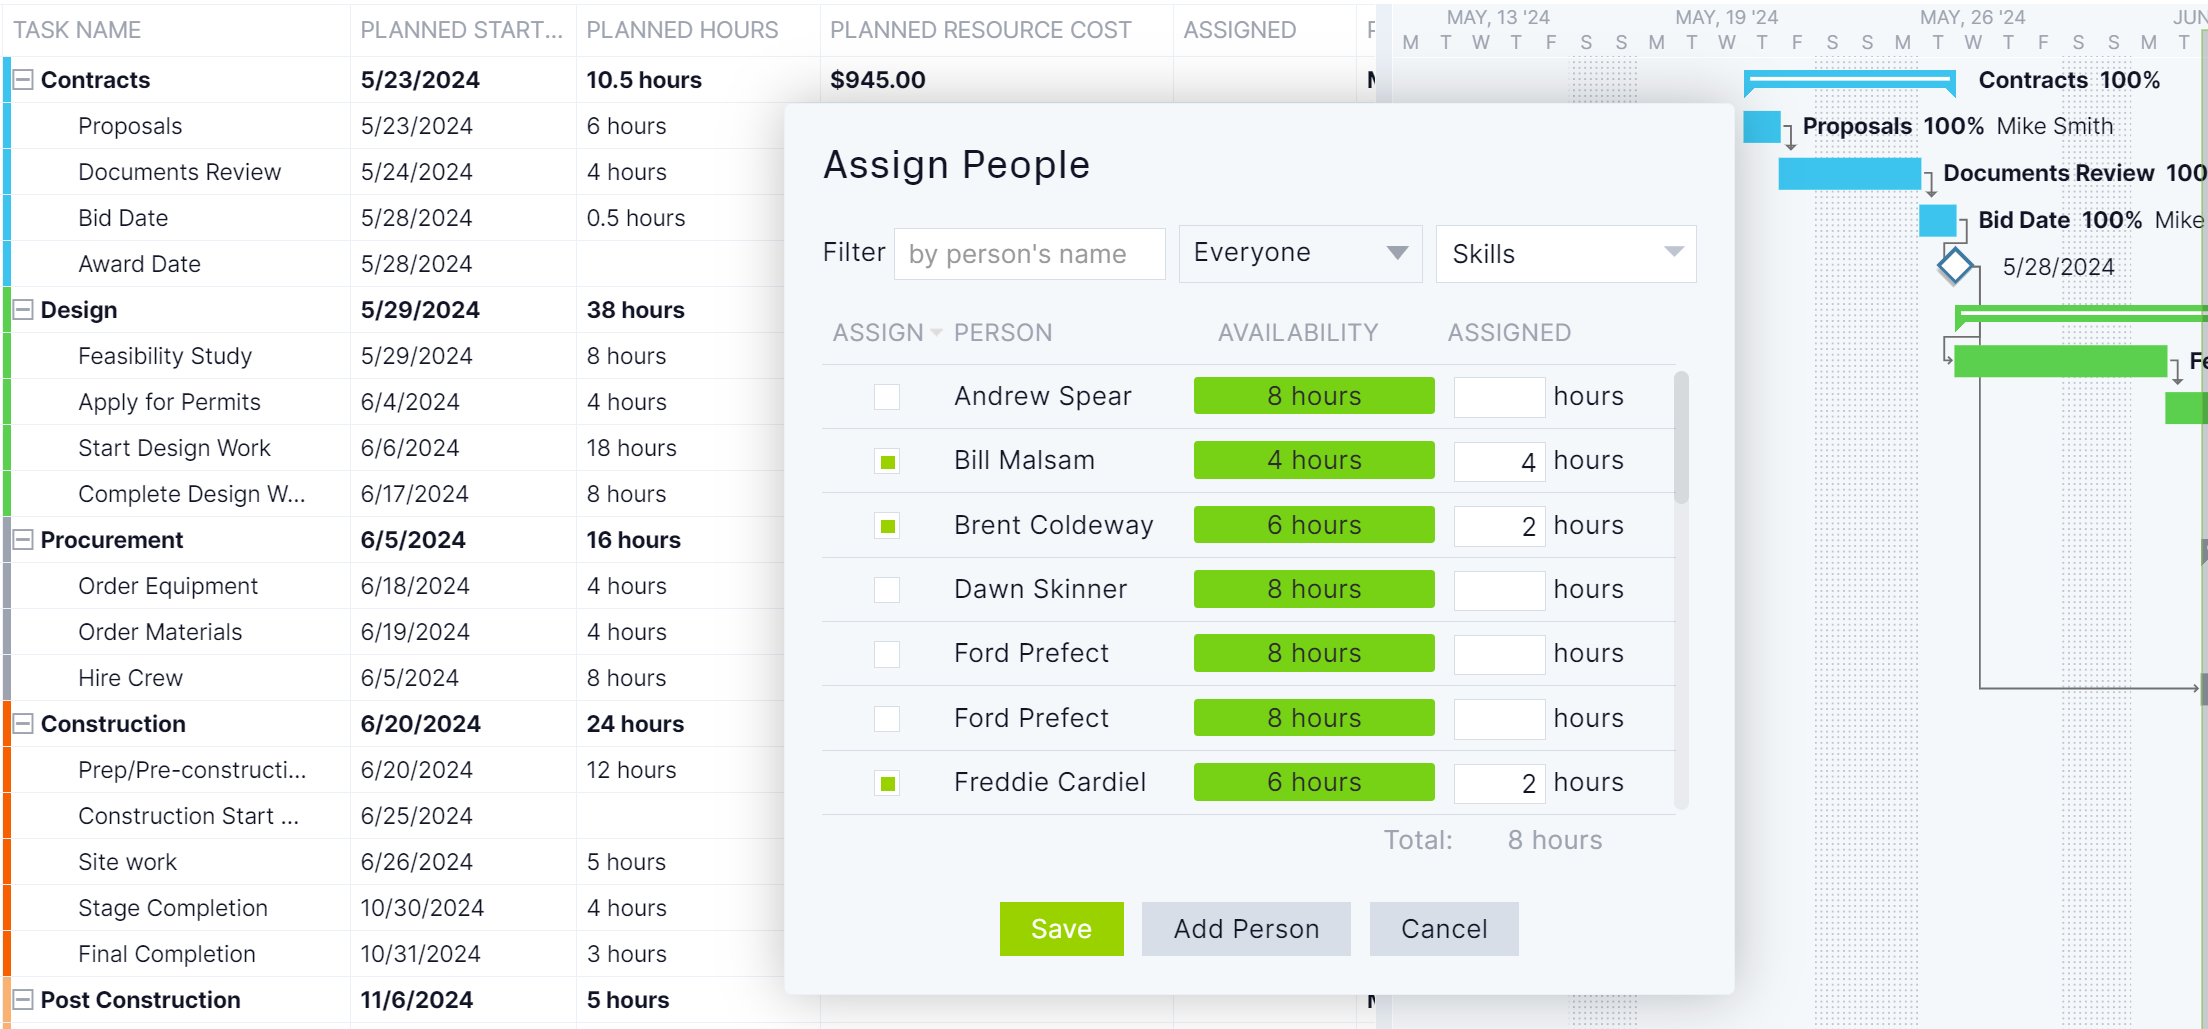
3. Assign Tasks to Team Members
The Gantt chart can then assign tasks to team members. Each team member can establish the hourly pay rate for each team member. A workload page provides a color-coded overview of resource allocation, allowing project managers to see who is overallocated or underutilized. They can then balance the workload to keep everyone working at capacity and avoid burnout. Secure timesheets let teams log their hours anywhere, anytime, which also provides a window into labor costs.
4. Estimate the Cost of Each Task
By adding the labor costs and any other non-human resource costs, project managers can forecast how much each task listed will cost. This allows for a more accurate estimate of the project budget.
5. Enter the Actual Cost of Each Task as They’re Completed
The planned costs are now in the software. As teams upload their status, the actual costs will update on the Gantt chart. This then provides the data by which our software can compare the planned vs. actual cost of the project.
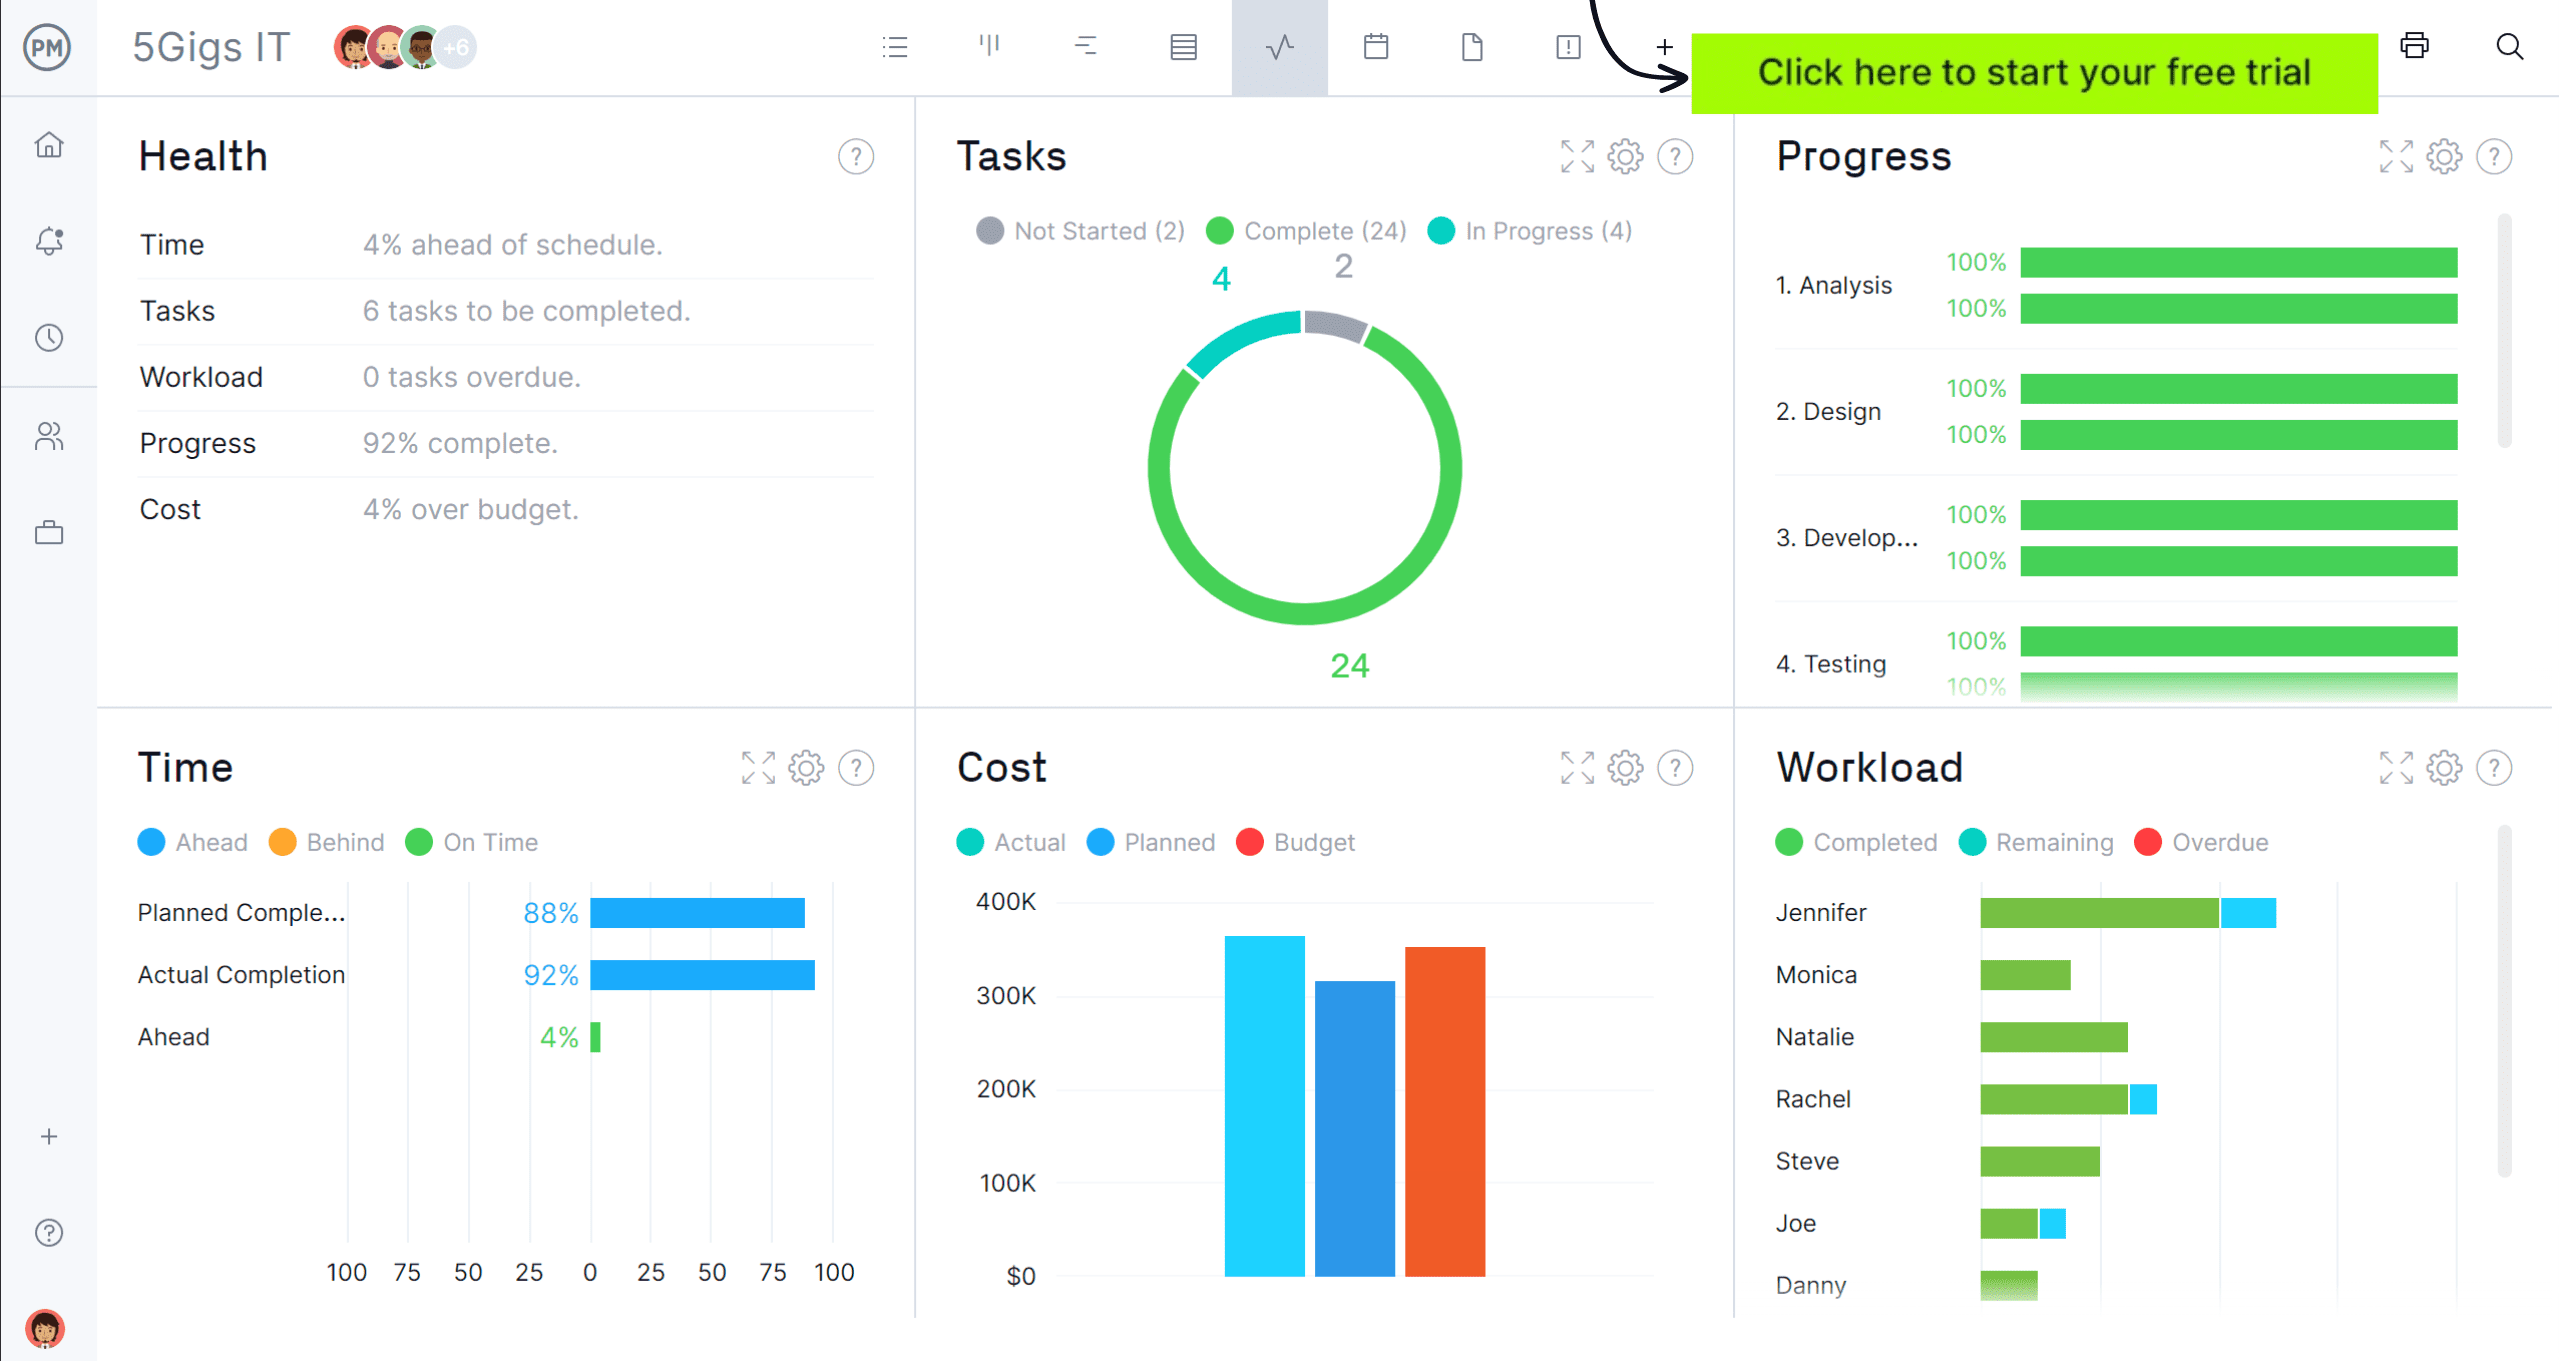
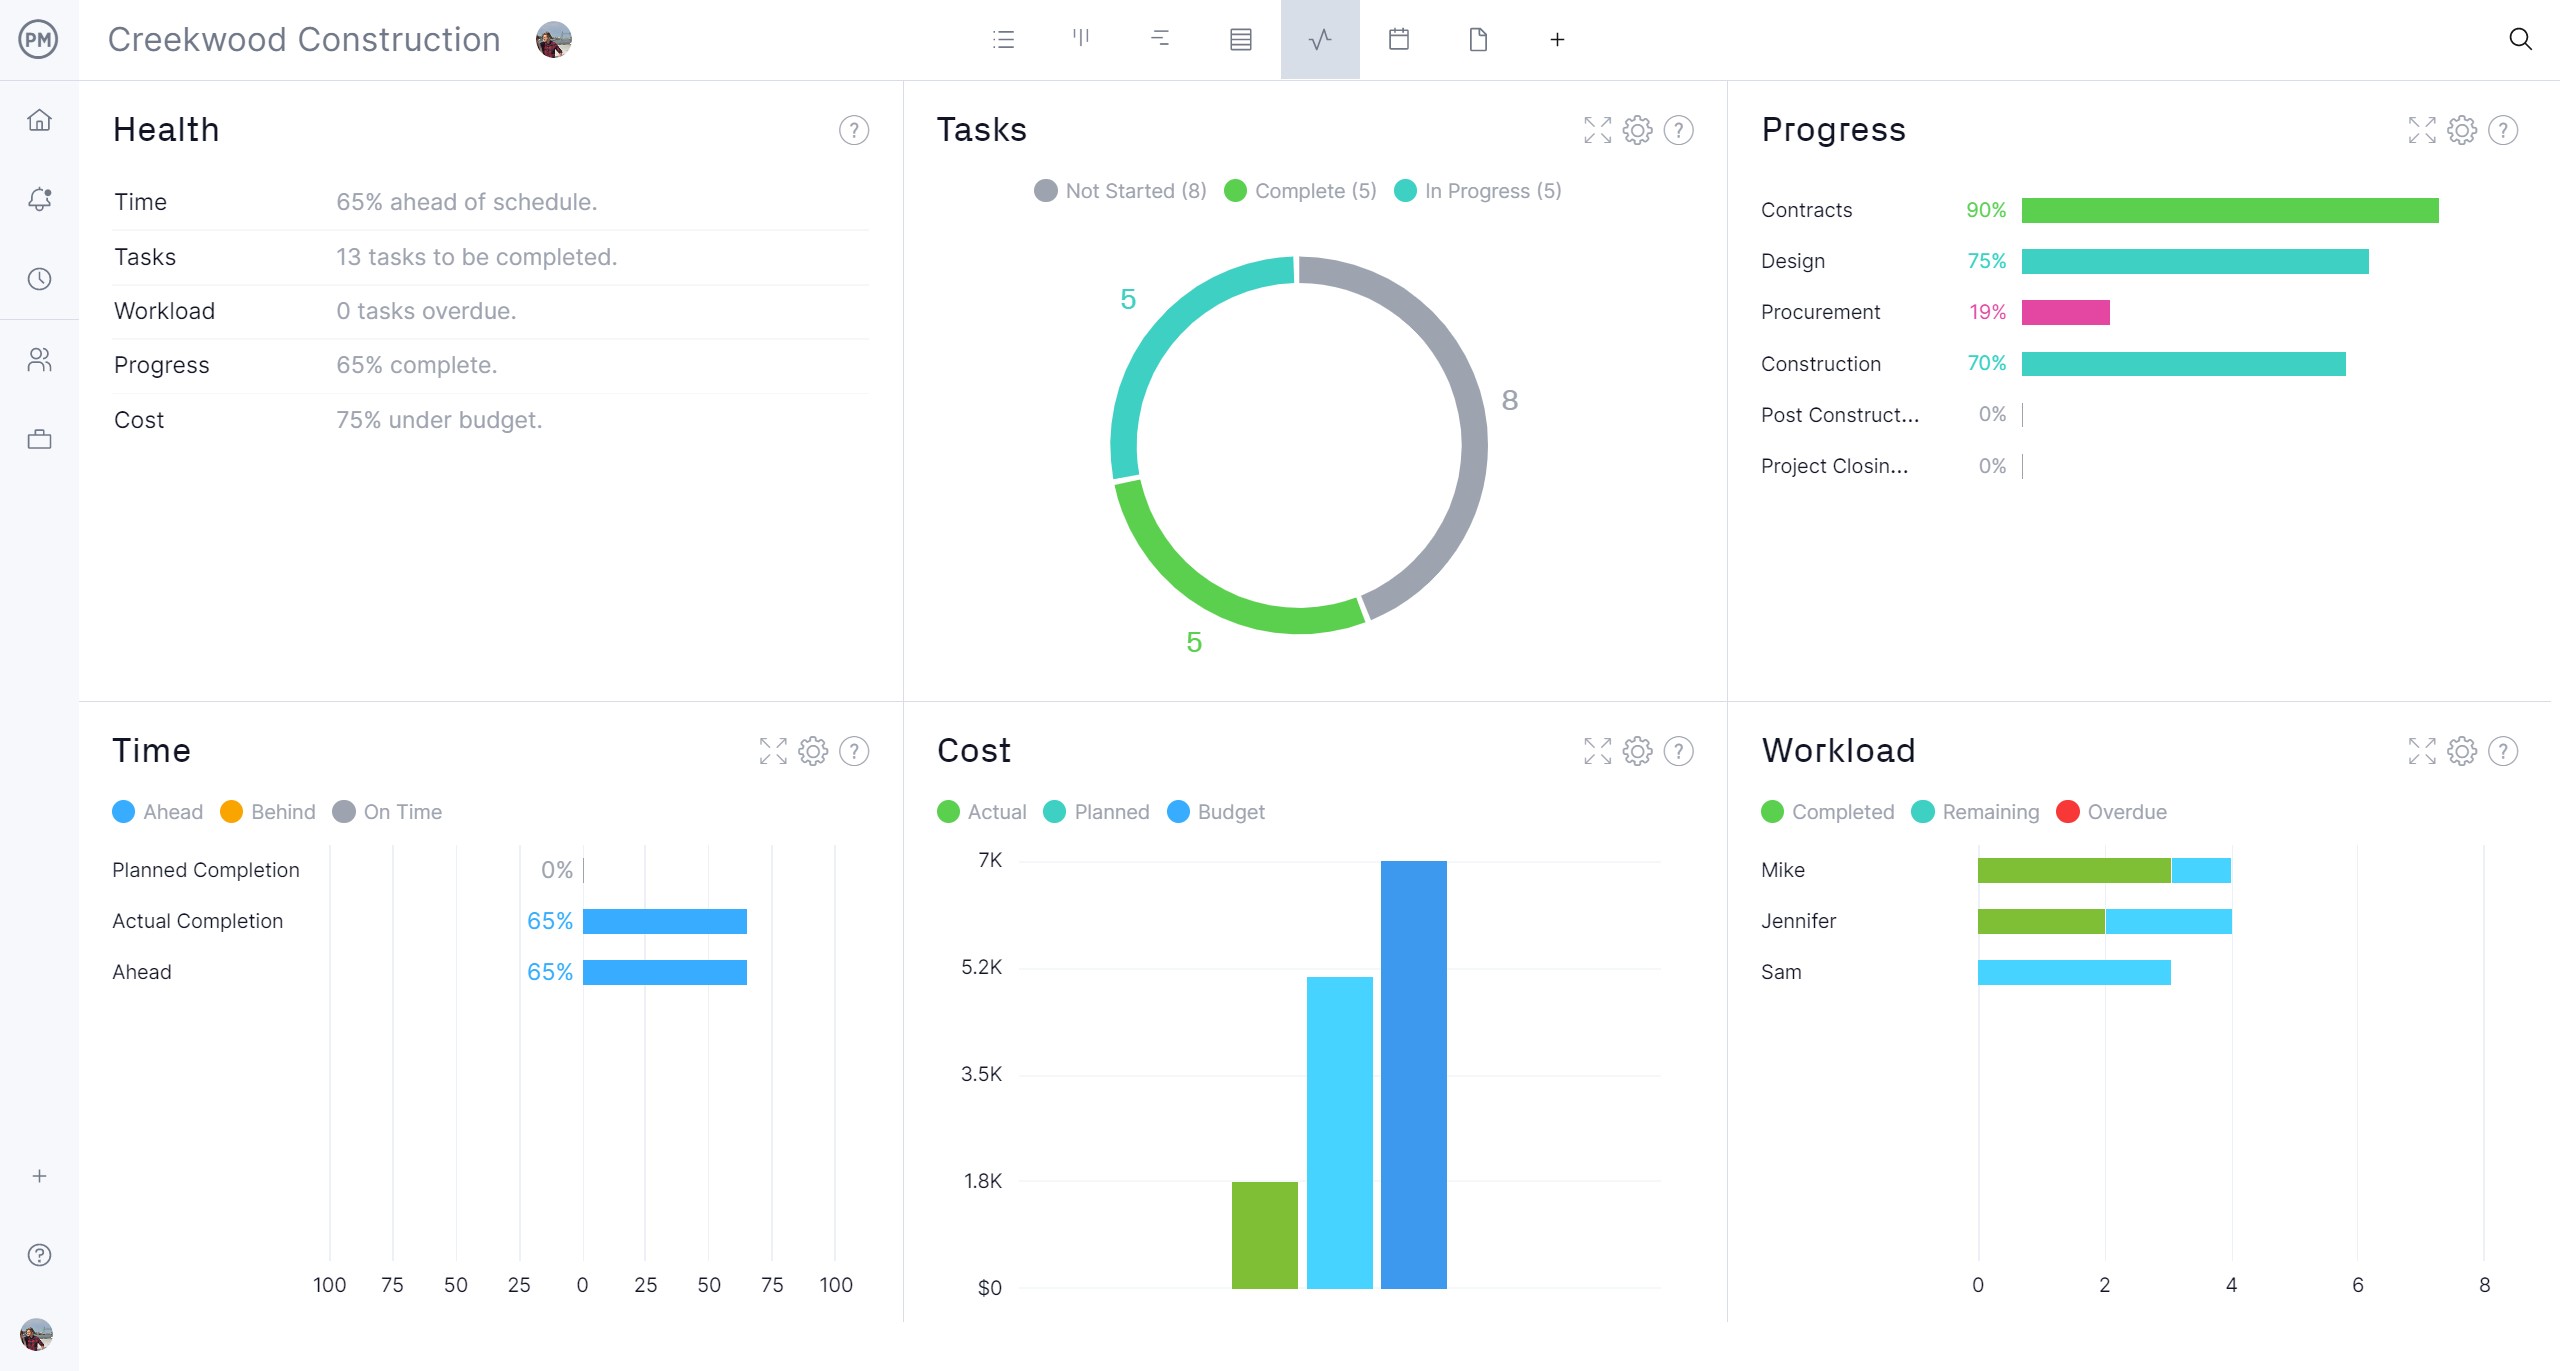
6. Monitor the Budget With ProjectManager’s Real-Time Dashboard
Once a baseline is set on the Gantt chart, the software automatically updates. Project managers can open up the real-time dashboard for an overview of the project costs, time, workload and more. They can also use customizable reports to get more details and even share them with stakeholders so they stay informed.
More Free Budgeting Templates
A budget dashboard is only one of the over 100 free project management templates for Excel and Word that help manage every aspect of a project, across multiple industries. Here are just a few that relate to budgets.
Project Budget Template
Download this free project budget template for Excel to create a more accurate budget for projects and even track them to keep to that budget. Our free template lists all project tasks and subtasks, then adds labor, material and other costs. Plus, there’s a column for actual costs to see if they’re aligned with the planned costs.
Operating Budget Template
An operating budget helps to forecast revenue and expenses over a period. Download this free operating budget template for Excel to get a detailed look at the coming year or quarter and accurately predict the revenue and expenses the organization is expected to make over that period.
Budget Proposal Template
Use this free budget proposal template for Excel to forecast all the costs associated with an upcoming project. It can be shown to potential stakeholders to secure funding. If approved, use this free template to build the budget for the project.
Related Budgeting Content
A budget dashboard is part of the larger budget management concern. For those who are interested in learning more about budgets, check out the handful of links below that were recently published and touch on free templates for budgets, what a budget report is and much more.
- 12 Budget Templates for Business & Project Budgeting
- What Is an Operating Budget? Key Components
- What Is a Budget Report? Purpose, Components & Benefits
- What Is a Business Budget? Business Budgeting Basics
- Tracking Budget Variance in Project Management
ProjectManager is online project and portfolio management software that connects teams whether they are in the office or out in the field. They can share files, comment at the task level and stay updated with email and in-app notifications. Join teams at Avis, Nestle and Siemens who use our software to deliver successful projects. Get started with ProjectManager today for free.