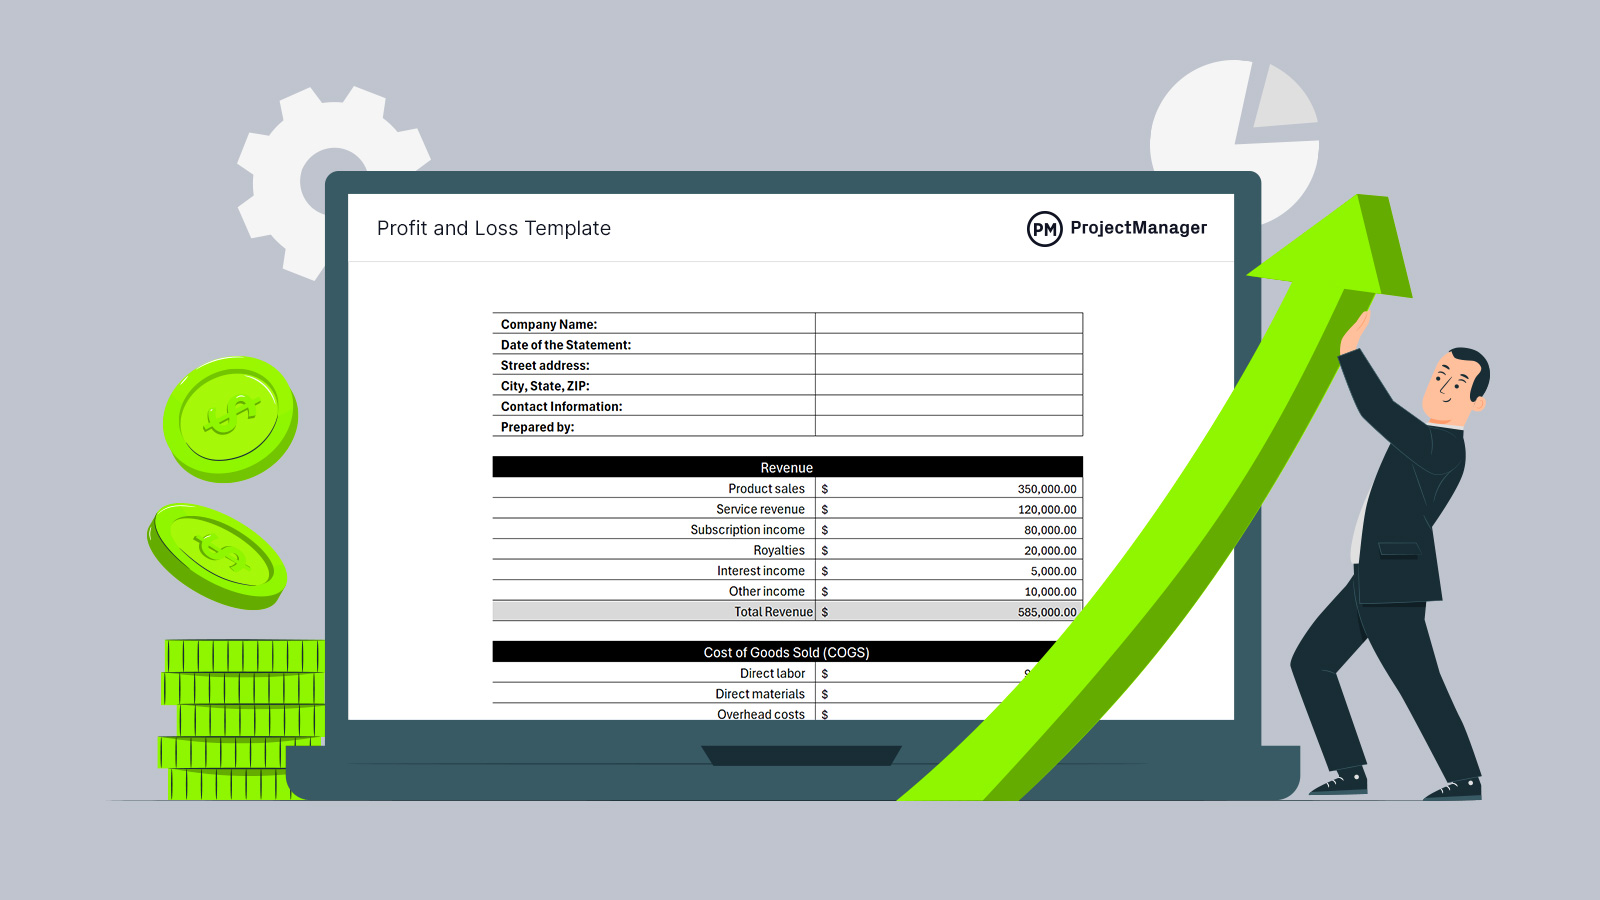
A profit and loss statement, also referred to as an income statement or P&L statement, is essential for businesses to track financial performance over a given period. It provides a clear breakdown of revenue, expenses and net income, helping businesses understand profitability and make informed decisions.
This profit and loss statement template simplifies the process by automating calculations, ensuring accuracy and saving time. Whether you’re a small business owner, freelancer or corporate manager, this template offers an efficient way to analyze financial data without complex spreadsheet formulas.
ProjectManager’s free profit and loss template for Excel
Why You Need a Profit and Loss Statement Template
Using this profit and loss statement template for Excel eliminates the hassle of manually calculating key financial metrics. It automatically sums up revenue, cost of goods sold, operating expenses and other crucial components. This automation ensures accurate results for gross profit, operating income and net income.
Additionally, it accounts for non-operating income and expenses, earnings before taxes and income tax expenses, providing a complete financial snapshot. By leveraging this template, businesses can streamline financial reporting and focus on strategic growth.
To achieve that strategic growth, build profits and keep within one’s operating costs, requires more than templates. You need project management software. ProjectManager is award-winning project and portfolio management software that has robust Gantt charts to schedule tasks as well as human and nonhuman resources with their related costs.
This can help forecast accurate budgets. But the Gantt chart also links dependences to avoid costly delays, filters for the critical path and sets a baseline to track planned against actual costs in real time Get started with ProjectManager today for free.
When To Use This Profit and Loss Statement Template
Businesses create profit and loss statements to assess their financial health, track profitability and make data-driven decisions. This statement helps business owners, investors and stakeholders evaluate revenue trends, control costs and identify areas for improvement. By regularly generating a P&L statement, businesses can monitor financial performance and plan effectively for future growth.
- Monthly: A monthly income statement provides a detailed view of short-term financial performance. It helps businesses track revenue and expenses closely, identify seasonal trends and make timely adjustments to spending or pricing strategies.
- Quarterly: Quarterly profit and loss statements are useful for evaluating financial performance over a broader period while still allowing for timely course corrections. They help businesses identify patterns, compare results with previous quarters and make strategic planning decisions based on emerging trends.
- Annually: An annual profit and loss statement provides a comprehensive financial overview for the entire year. It is crucial for tax reporting, long-term planning and assessing overall profitability. Businesses use annual statements to present financial results to investors, secure funding and refine long-term strategies.
How to Use the Profit and Loss Statement Template
Download this free profit and loss statement template for Excel and open a fully customizable spreadsheet. While users can edit it as they like, we have formatted it in a general way to make it more helpful.
1. Measure Revenue
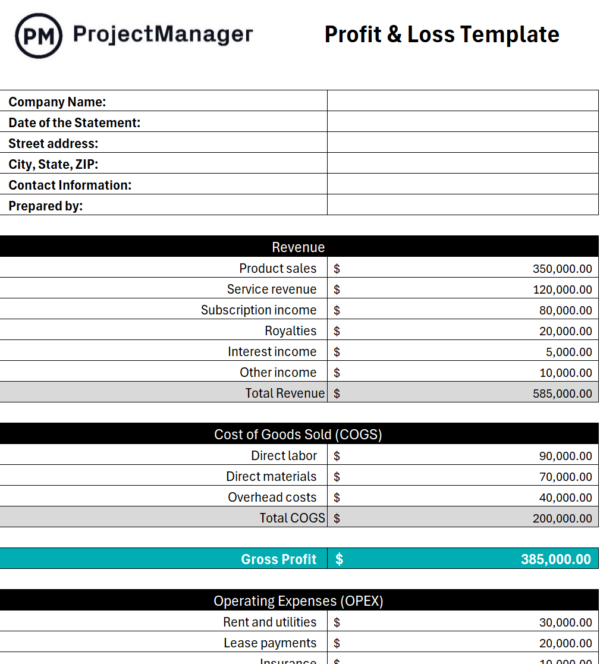
Revenue represents the total income generated by a business from its primary operations before deducting any costs. It serves as the starting point for evaluating financial performance, providing insight into a company’s ability to generate sales. Revenue is essential for determining profitability and making financial forecasts.

- Product sales: Revenue from selling physical goods.
- Service revenue: Income from providing professional services.
- Subscription income: Recurring revenue from subscription-based offerings.
- Royalties: Earnings from intellectual property usage.
- Interest income: Revenue generated from interest-bearing assets.
- Other income: Any additional earnings outside primary business activities.
2. Calculate the Cost of Goods Sold (COGS)
In an income statement, the Cost of Goods Sold (COGS) represents the direct costs associated with producing goods or services. It includes expenses that are directly tied to production, such as materials and labor. COGS is crucial in determining gross profit, as it reflects the costs needed to generate revenue.

- Direct labor: Wages paid to employees involved in production.
- Direct materials: Costs of raw materials used in products.
- Overhead costs: These are other expenses that can’t be considered direct materials or labor, typically related to the functioning and maintenance of production facilities and utilities.
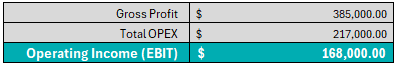
3. Measure Gross Profit
Gross profit is calculated as revenue minus COGS and indicates the efficiency of a company in producing and selling its goods or services. A higher gross profit margin suggests strong pricing and cost control strategies. This profit and loss statement template for Excel automatically calculates gross profit, making financial analysis easier and more accurate.

4. Calculate the Cost of Operating Expenses (OPEX)
Operating expenses (OPEX) refer to the costs incurred in running daily business processes. Unlike COGS, these expenses are not directly tied to production but are essential for maintaining business functions. Managing OPEX effectively helps businesses optimize profitability.
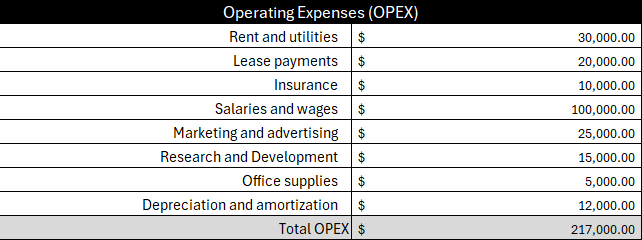
- Rent and utilities: Costs for office or facility space and services.
- Lease payments: Expenses related to leased equipment or property.
- Insurance: Coverage costs for business assets and liabilities.
- Salaries and wages: Employee compensation outside of direct production.
- Marketing and advertising: Costs for promotions and customer acquisition.
- Research and Development: Investments in new products or improvements.
- Office supplies: Expenses for day-to-day operational materials.
- Depreciation and amortization: Non-cash expenses for asset value reduction over time.
5. Calculate Operating Income
Operating income is the profit earned from core business activities after deducting operating expenses. It provides insight into operational efficiency and profitability before considering non-operating factors. This template automatically calculates operating income, simplifying financial analysis and reporting.
6. Define Non-Operating Income & Expenses
Non-operating income and expenses refer to financial activities that are not related to a company’s primary operations. These include gains or losses from investments, interest and asset sales. Understanding these items helps businesses evaluate external financial impacts.
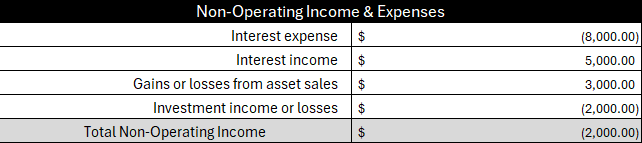
- Interest expense: Costs incurred from borrowed funds.
- Interest income: Earnings from investments or savings.
- Gains or losses from asset sales: Financial impact of selling business assets.
- Investment income or losses: Returns or losses from market investments.
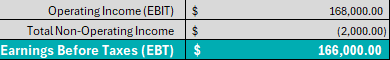
7. Earnings Before Taxes (EBT)
Earnings Before Taxes (EBT) is a crucial metric in a profit and loss statement that represents a company’s profitability before accounting for income taxes. It provides insight into the company’s operational efficiency and financial performance without the influence of tax considerations. This free Excel profit and loss statement template automatically calculates this value, which ensures accuracy and saves time, allowing business owners to focus on analyzing their company’s pre-tax earnings and making informed decisions.
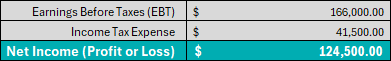
8. Income Tax Expense
Income Tax Expense is a significant line item in a profit and loss statement that represents the amount of taxes a company owes based on its taxable income. It’s crucial for understanding a company’s tax obligations and its impact on overall profitability. This is also automatically calculated thanks to the formulas in this P&L statement template for Excel.

9. Net Income (Profit or Loss)
Net Income, also known as the bottom line, is the final figure in a profit and loss statement that represents a company’s total earnings or losses after all revenues, expenses and taxes have been accounted for. It’s a critical indicator of a company’s overall financial health and profitability. This value is calculated by the template once all the other elements of the profit and loss statement have been filed out.
Related Project Management Templates
The profit and loss statement template is one of over 100 free project management templates for Excel and Word that cover all aspects of managing a project across multiple industries. Below are some of those templates that are related to managing costs.
Budget Dashboard Template
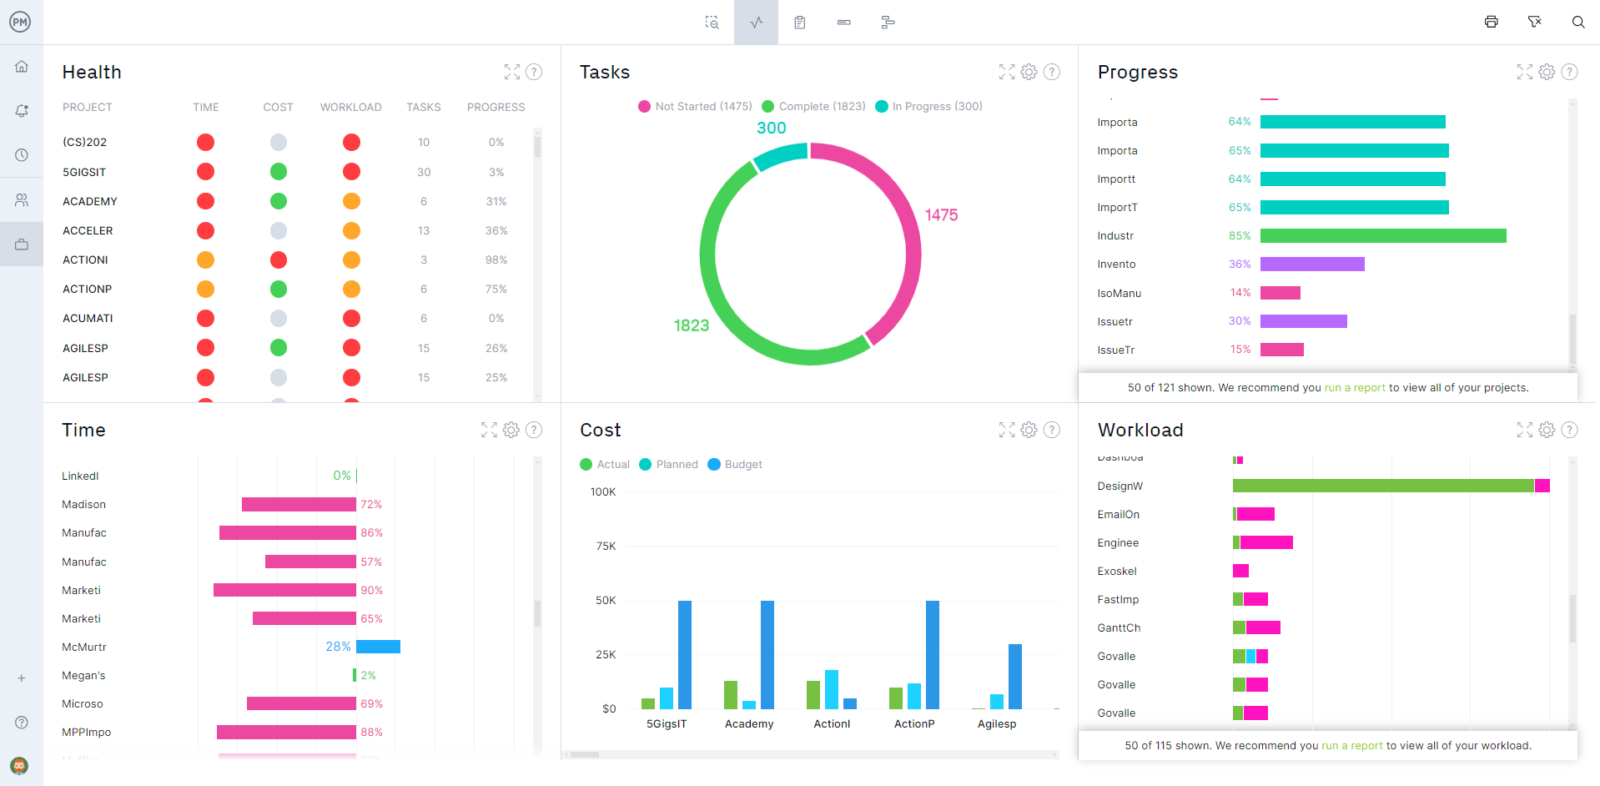
Dashboards are visual tools that track metrics. This free budget dashboard template for Excel is focused exclusively on finance. It has bar and pie charts to measure the total cost, planned vs. actual costs and other cost breakdowns.
Operating Budget Template
Download this free operating budget template for Excel to accurately predict the revenue and expenses an organization can expect to make over a quarterly or yearly time period. This helios to create financial accountability and plans and manages resources.
Cost-Benefit Analysis Template
Use this free cost-benefit analysis template for Excel to compare what one expects to pay for a project against the benefits opportunities it will provide. This helps one to decide whether to move forward with a project or not.
How to Manage Project Costs and Profitability With ProjectManager
The profit and loss statement template and all of these free templates are a great workaround, but they’re not without issues. For one, these are static documents that have to be manually updated. That is time consuming and takes one away from more pressing needs. To avoid that, explore the advantages of project management software. ProjectManager is award-winning project and portfolio management software that has multiple project planning, scheduling and tracking tools to help keep projects on budget and ensure profits.
Manage Resources and Stay Productive
One of the main advantages of using ProjectManager is that it offers a variety of project management tools. Gantt charts schedule resources, but those resources need to be assigned to tasks to execute their work. Start by setting their availability when onboarding teams. This includes PTO, vacation and global holidays and allows for the right person to get the right assignment at the right time. View resource allocation across all projects on the color-coded workload page. See who is overallocated or underutilized and balance the whole team’s workload without leaving the chart. A daily and weekly team page summarizes their activities, can be filtered by priority or progress and updates tasks right from that page.
Track Costs With Real-Time Dashboards and Reports
There are several ways to monitor that costs are keeping to the budget. For a high-level overview, use the real-time project or portfolio dashboards. They collect live data and display time, cost, workload and more metrics on easy-to-read graphs and charts. Customizable reports go deeper into the data, such as project or portfolio status, variance, workload, timesheets and other reports. All reports can be filtered to show key data points or general progress, which can be shared with stakeholders. Even secure timesheets help to stay on budget by tracking labor costs.
Related Content
A profit and loss statement template is only a small part of the financial coverage found on our blog. For those who care to read more on the subject, below are links to some of the more recent pieces we’ve published on the subject.
- How to Write a Business Plan
- What Is a Business Budget? Business Budgeting Basics
- Budget Templates for Business & Project Budgeting
- Importance of Scenario Planning and Analysis in Business
- What Is Project Accounting? Principles, Methods & More
- Best Project Management Accounting Software
ProjectManager is online project and portfolio management software that connects teams whether they’re in the office or out in the field. They can share files, comment at the task level and stay up to date with email and in-app notifications. Join teams at Avis, Nestle and Siemens who use our software to deliver successful projects. Get started with ProjectManager today for free.