Asana is popular project management software, but does it have all the features project managers and their teams need? Let’s narrow the focus and spotlight one feature, the Asana dashboard. Does the tool have this feature and, if it does, how robust is it?
A dashboard is essential for monitoring key performance indicators (KPIs), such as time tracking, work management and more. Is an Asana dashboard up to the task? Let’s find out! We’ll review Asana, see if it has a dashboard and explore alternatives that might better serve project teams.
What Is Asana?
Asana is project management software designed to help teams and individuals organize work, collaborate and stay on top of deadlines. It allows users to create tasks, assign them to team members, set deadlines, track progress and communicate about projects in real time.
The software has different views, such as the list view, board view and calendar view, which help users manage their workflows in a way that works best for them. That makes the tool widely used for managing everything from simple to complex projects in various industries.
While used for project management, Asana is more of a comprehensive work management platform that helps teams coordinate and manage their tasks, projects and workflows in one place. It’s designed to increase productivity, improve communication and ensure that work progresses efficiently.
Features found on the software include collaboration tools that allow team members to comment directly on tasks, share files, tag others and mention them in comments to ensure everyone stays updated. There are also customizable workflows, a timeline that is similar to, but not as robust as a Gantt chart and workload management to prevent overloading team members.
Does Asana Have a Dashboard?
That’s a fair amount of project management features, but the reason we’re here is to see if there is an Asana dashboard. Any project management software worth its price will have a dashboard to provide a high-level overview of the project’s progress and performance.
Short Answer: Yes, Asana Has a Dashboard
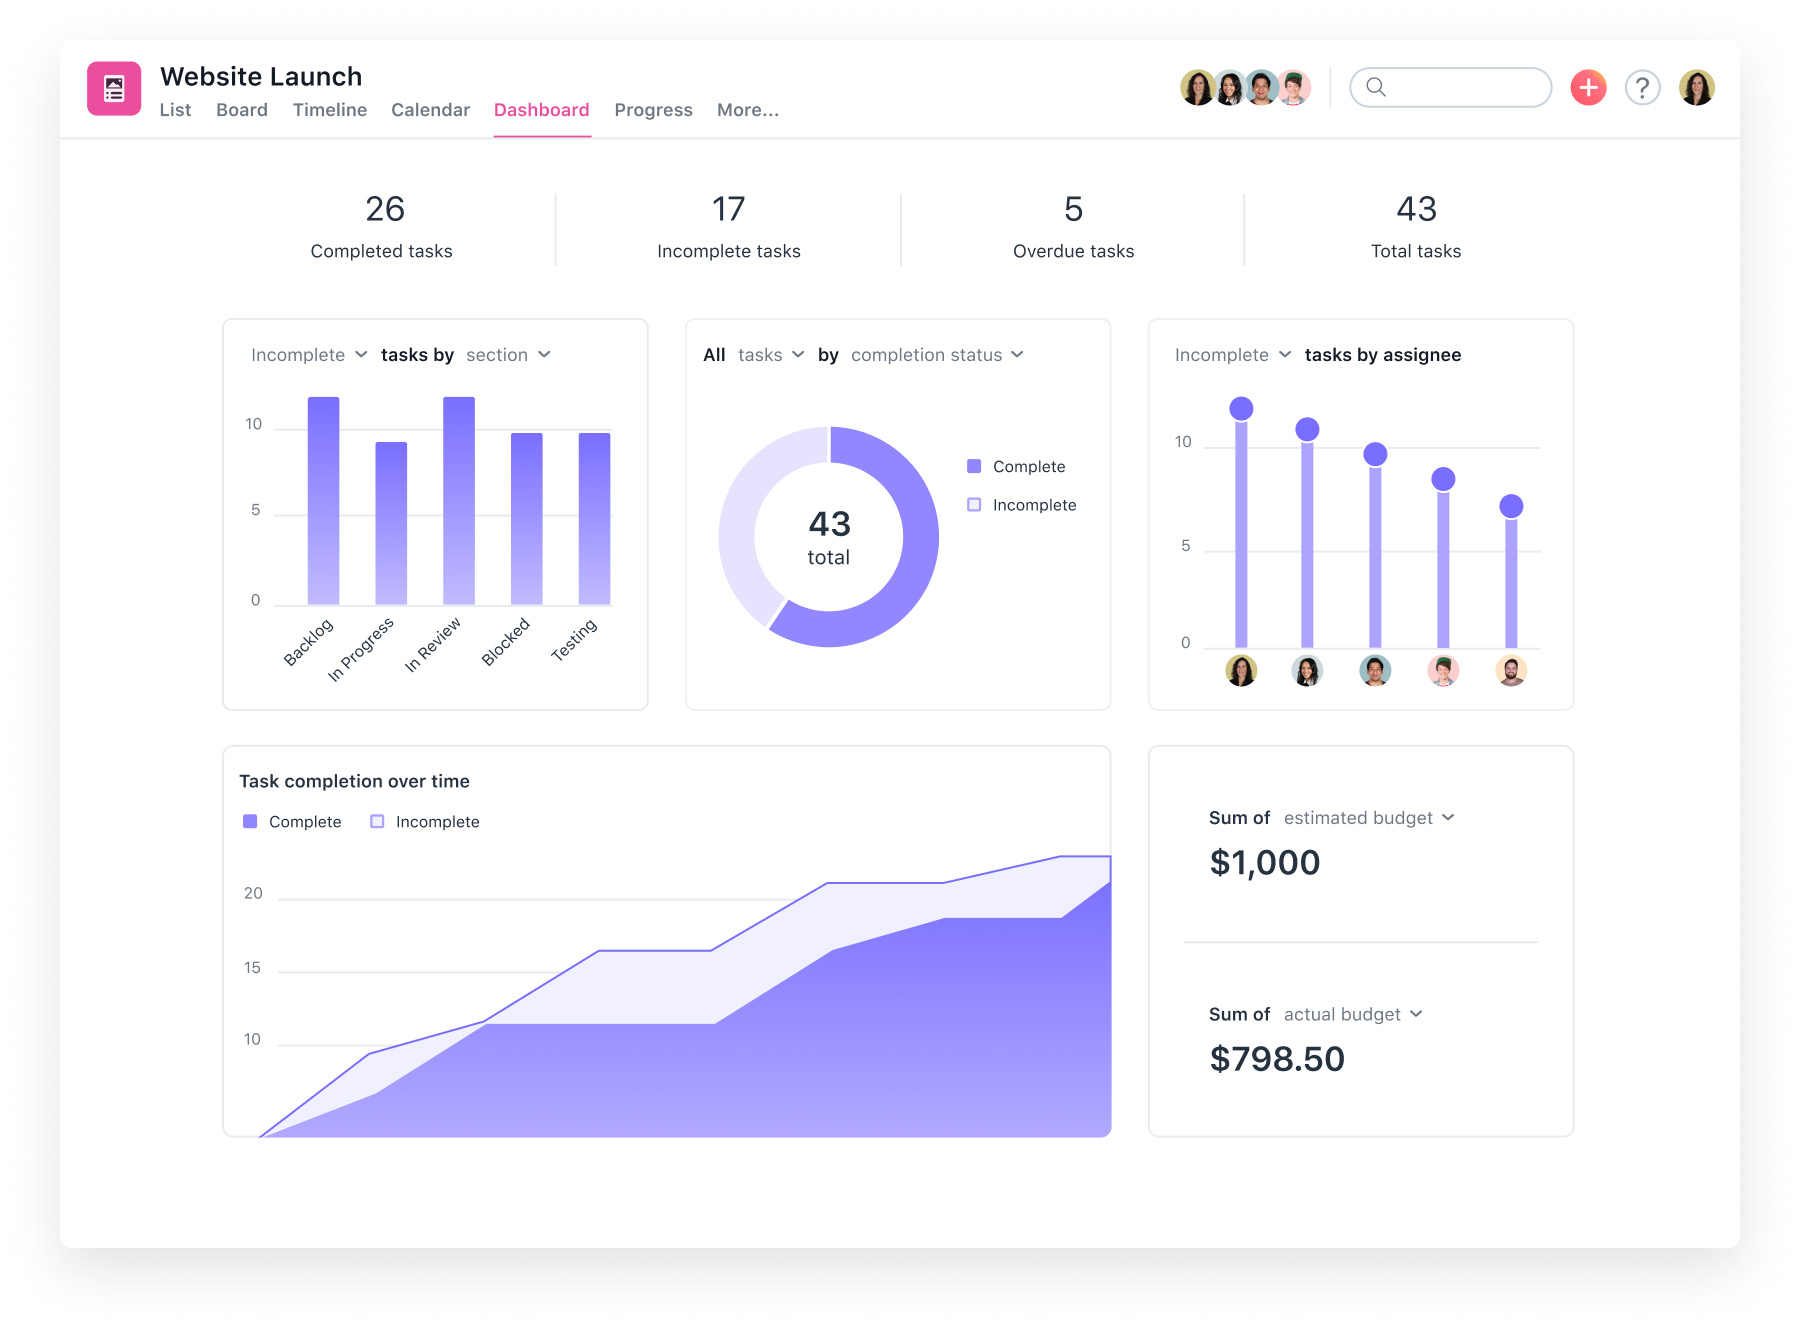
There is an Asana dashboard. It provides the basics one would expect, such as an overview of the team’s projects and tasks. While the tool helps track progress and spot potential bottlenecks, these are the bare minimum users should expect from the dashboard, which leaves many users looking for an Asana alternative.

Long Answer: Asana Dashboards Lack Key Features for Project Management
An Asana dashboard doesn’t measure up to other dashboard tools found in other, more powerful project management software. Let’s look at just a few of the features missing from this dashboard.
- No Cost or Budget Data: Asana dashboards don’t natively track financial metrics like project costs, budgets, or expenses, which are critical for teams managing resources and budgets. External tools or integrations are needed to fill this gap.
- Not Suitable for Project Portfolio Management: Asana dashboards are primarily project-specific and lack robust tools to manage portfolios. They don’t provide an overarching view of all projects, resource allocation, or prioritization across a portfolio without additional customization or integrations.
- No Planned vs. Actual Data: Asana does not offer a native feature to automatically compare planned timelines, effort or costs with actual outcomes. Users must rely on manual inputs or external tools for this functionality, which can be time-consuming and prone to error.
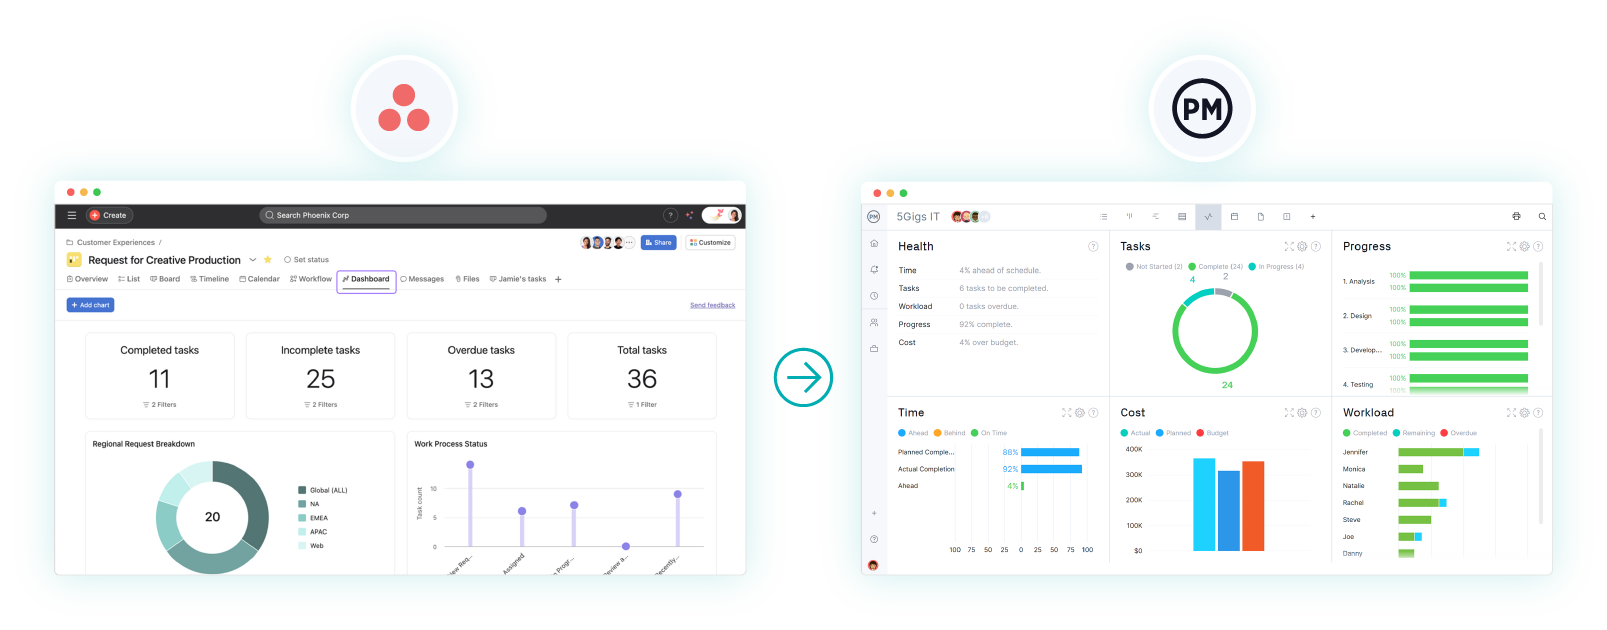
For those looking for an alternative to the lightweight Asana dashboard, other project management software products on the market are designed with project managers and their teams in mind. ProjectManager is award-winning project and portfolio management software that has real-time project and portfolio management dashboards. Our dashboards provide cost and budget data, can monitor one project, a program or a portfolio of projects and compare the planned effort against the actual effort so project managers get the insights they need to adjust resources as necessary to keep projects on track. Get started with ProjectManager today for free.
Cons of Making an Asana Dashboard
We’ve noted a few of the issues with an Asana dashboard, but there are more disadvantages. That’s because their dashboard is only part of the larger software product they offer, which has many problems that any project team should be aware of.
While Asana is a popular tool, there are cons to consider. This is especially true when using features like the Asana dashboard. Let’s break down the cons of using a dashboard in Asana and some general drawbacks of the platform itself.
Limited Timeline Functionality
Some refer to this feature as a Gantt chart. It is not. At best, this is a lightweight version of a Gantt chart. It can be used to create task dependencies and visualize project timelines but lacks some of the more advanced features that full-fledged Gantt chart tools like ProjectManager offer.
Related: Asana Gantt Chart: A How-to Guide With Pros, Cons & Alternatives
For example, there is no baseline tracking, which means that an Asana dashboard can’t provide vital information on the current status compared to where the project was planned to be at that time. There’s also no advanced critical path analysis and more intricate dependency handling is limited or absent.
Asana Dashboard Customization Limitations
Customization options can be restrictive. Users can’t always tailor the dashboard to exactly match their team’s needs, such as adding complex metrics of different types of widgets. The level of insight is therefore limited compared to specialized reporting tools or business intelligence platforms.
Data Overload
If teams have multiple projects, the Asana dashboard can quickly become overwhelming, with too many metrics and updates. It can be a challenge to prioritize what’s most important, and users might find themselves sifting through unnecessary information. The visual clutter might make it harder to find key insights.
Not Ideal for Complex Reporting
An Asana dashboard gives an overview of the status of tasks, but it’s not designed for deep data analysis or complex reporting. For those looking for more advanced analytics, like custom metrics or the ability to track performance across different teams and departments, this dashboard falls short.
How to Make an Asana Dashboard Better With ProjectManager
If one wants to make an Asana dashboard better or enhance the reporting and project management experience, make the dashboard better by getting it into a real project management software, like ProjectManager with robust Gantt charts, reporting features and task dependency management. See for yourself by following these steps.
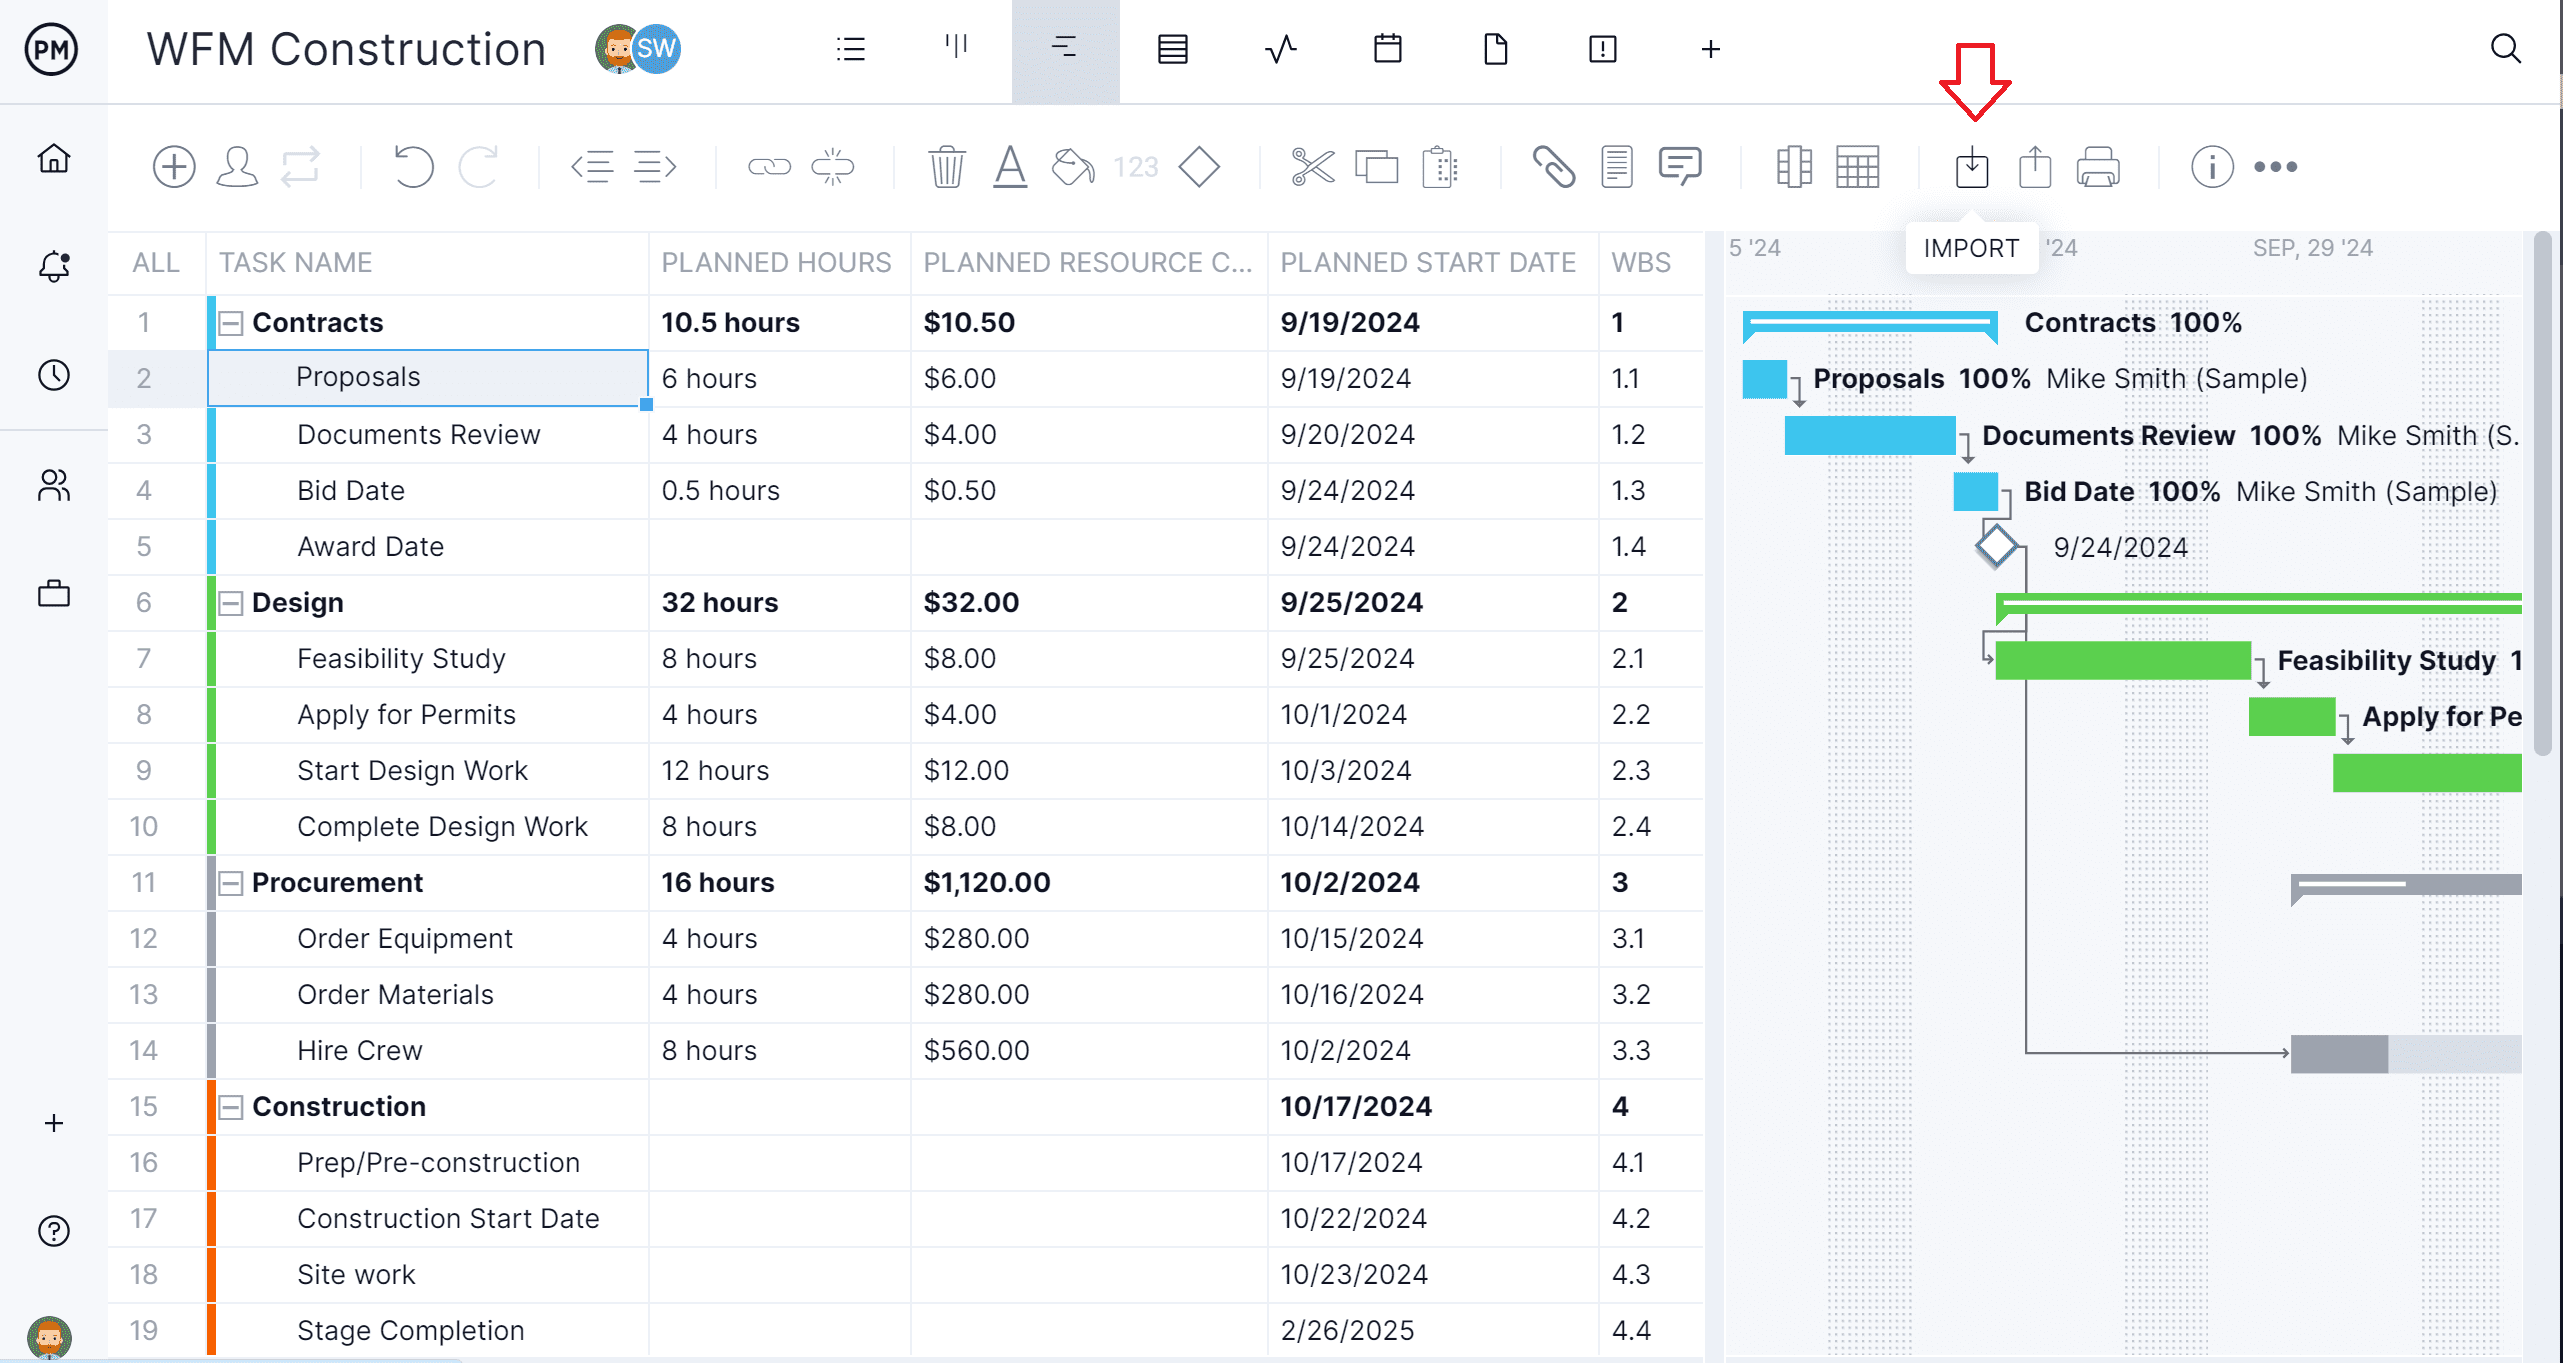
1. Export Your Asana Project
Open the project in Asana and, in the project menu, look for the export/import option. Select export to CSV and download that file, which will contain the project data.
2. Select the Excel File and Import Into ProjectManager
Now, start a free trial with ProjectManager, no credit card is required. Log into the account and go to the projects tab. Then, select import and choose the CSV file that was exported from Asana. Upload that file into ProjectManager.
3. Add the Data to a New or Existing Project
When prompted, decide if you want to create a new project or add the data to an existing project in ProjectManager. If you choose to add the data to an existing project, make sure the project in ProjectManager aligns with the Asana project structure or manually match the task categories and columns.
4. Choose What Data to Import & Toggle to the Dashboard View
Once the file is uploaded, ProjectManager asks which data to import. The user can add all the data or choose the specific task details to import, such as task name, assignee, due dates, priority level and progress status. The software will map these fields from the Asana project to the corresponding fields in ProjectManager. You’ll also want to set a baseline on the Gantt chart to compare planned vs. actual data on the dashboard. Then, toggle to the dashboard to access the live project data.
5. Success! View Asana Dashboard Data in ProjectManager
After these steps, your import has been completed successfully. Now users can view the project in more advanced ways, such as on Gantt charts, which link all four types of task dependencies. There’s also time tracking and robust reporting.
ProjectManager Has a Better Dashboard Than Asana
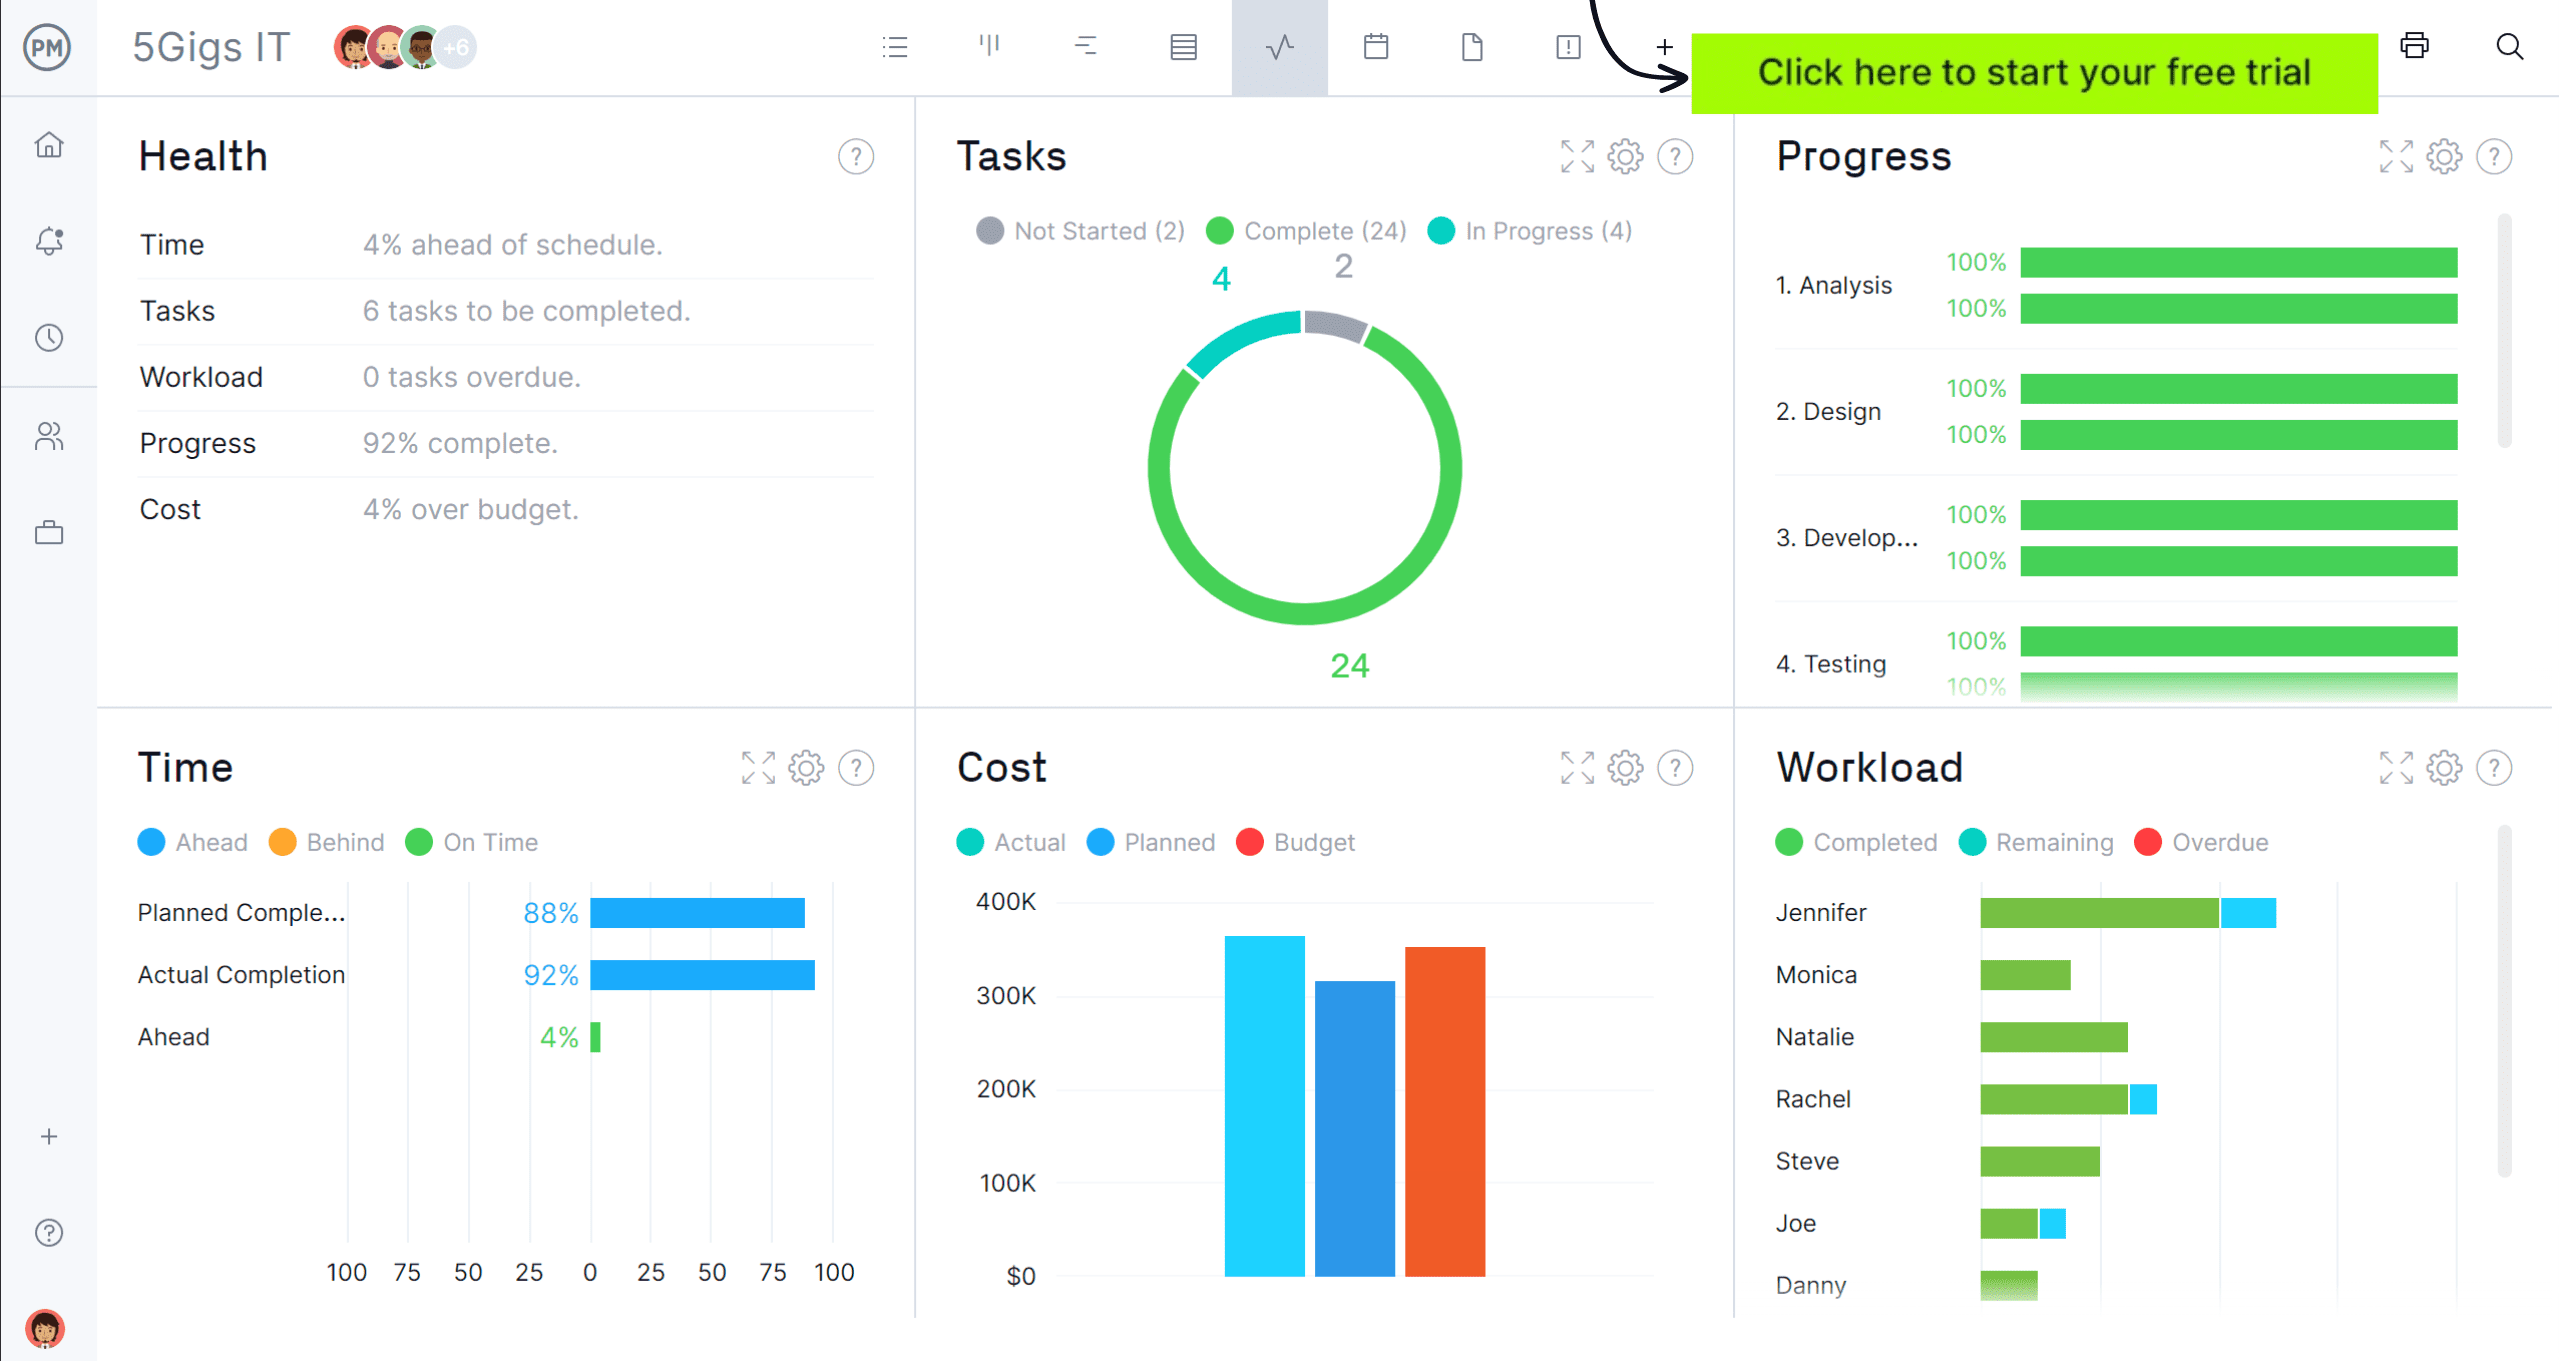
After taking a project for a spin through our software it will quickly become apparent that ProjectManager’s dashboard makes an Asana dashboard feel old and tired. Our software has more advanced and feature-rich dashboards that give users comprehensive project tracking and reporting capabilities. Let’s take a closer look at the advantages of using our dashboard.
- Project Portfolio Management (PPM) Dashboard: ProjectManager has PPM features, including a dashboard that consolidates data from multiple projects and allows project, program and portfolio managers to make informed decisions with real-time information, whereas an Asana dashboard is focused solely on individual project tracking.
- Planned vs. Actual Project Management Data: ProjectManager shows planned vs. actual data for timelines, tasks and milestones across all projects through visual charts on the dashboard and its Gantt charts. Asana does not have as sophisticated, integrated tools for comparing planned vs. actual in real time across all projects.
- Progress Tracking: ProjectManager has a variety of ways to track project milestones, task completion percentages and the overall health of a project, while Asana is more simplistic, primarily tracking task completion and the project timeline.
- Cost Tracking: With ProjectManager, users can track budget vs. actual expenses in real time, as it integrates cost management directly into project timelines. In contrast, Asana does not offer integrated cost tracking. It lacks in-depth cost management and reporting features.
- Workload Management Data: ProjectManager’s dashboard provides a workload management dashboard that gives a view of team capacity, which helps managers distribute work evenly across resources and enables resource leveling and identification of bottlenecks in workload distribution. An Asana dashboard has a workload view but doesn’t offer the same depth of resource management and reporting, especially for cross-project resource balancing.
- Slippage Reporting: ProjectManager automatically tracks task delays, project milestone slippage and overall project timeline drift, generating reports that help project managers address issues early on. Asana requires manual tracking and doesn’t have a specialized reporting feature that tracks slippage across tasks and projects in the same detailed way.
Asana Dashboard Example
We’ve only shared a screenshot of an Asana dashboard. But to give the tool its due, let’s look at one in action to drill down a bit on what it is and what it is doing. Below is another screenshot of the dashboard in action. It’s made up of a couple of graphs and some summary data. As we’ll see, the data is helpful but not as robust as project managers need to deliver projects successfully.
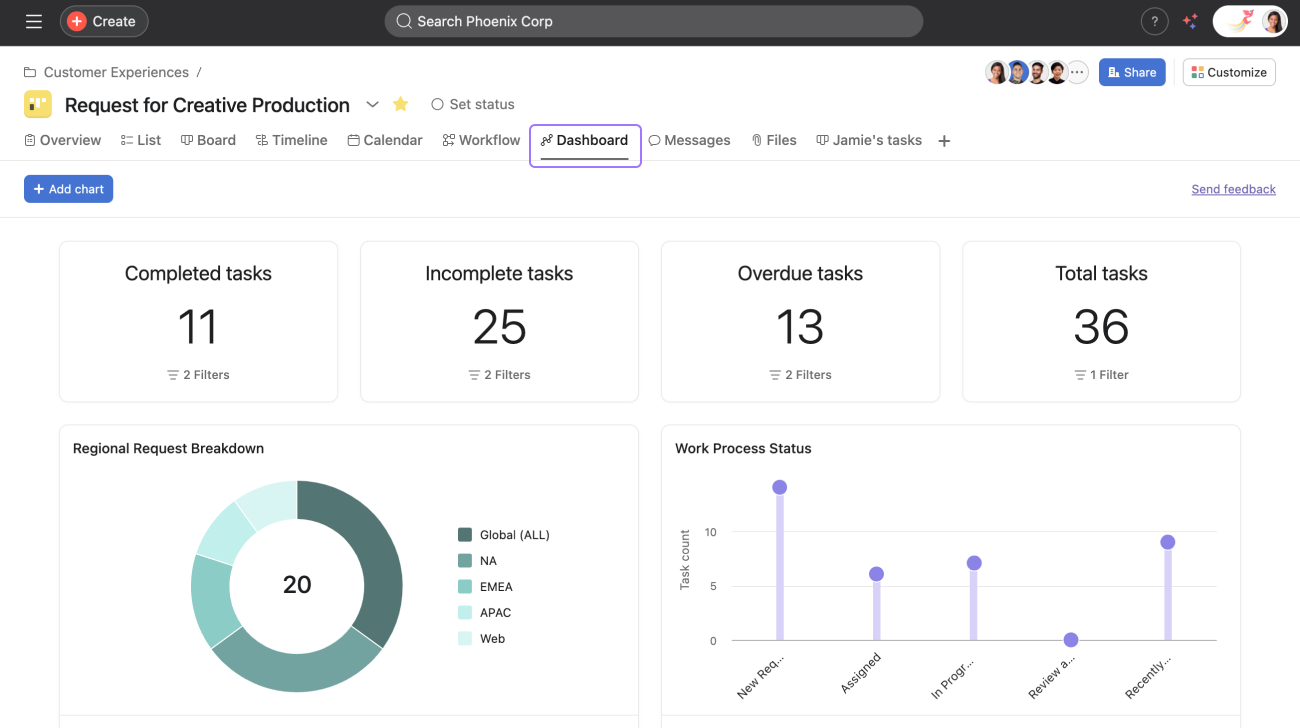
The top row summarizes the amount of complete, incomplete and overdue tasks. It also lists all the project tasks, which helps project managers figure out how close they are to delivering the project. There’s a pie chart underneath that with a regional request breakdown. A bar chart shows the work progress status.
How to Make a Dashboard In Asana
We’ve not discussed how many project management software products are hard to make and don’t automatically generate dashboards as with ProjectManager. These tools require excessive manual work, confusing user interfaces and limited reporting flexibility.
However, for those who want to go through the trouble of making an Asana dashboard, first choose the right view for the dashboard. Asana offers several ways to visualize project data, such as with lists, boards, timelines and dashboards. The latter is its native reporting tool, where users can create custom dashboards to show charts, graphs and other widgets based on project data.
To create a dashboard report, click on “create a new report.” Choose the type of report (e.g., task completion, overdue tasks, etc.). Users can filter data by projects, teams, assignees or task status. Then customize the widgets (such as bar charts or pie charts) to show the specific information.
Why ProjectManager Is Better Project Tracking Software Than Asana
If that sounds like a lot of work, it is. Who has the time to manually configure an Asana dashboard when managing projects? There are better alternatives to Asana. Project management professionals want a tool that is efficient and effective at more than task and work management. They don’t want something like Asana that requires them to step away from managing their project to manage their project management software. That’s why project managers and their teams prefer ProjectManager, award-winning project and portfolio management software with real-time project and portfolio dashboards that are ready when they need them.
Plan, Schedule and Track With Multiple Project Management Views
Just like Asana, ProjectManager has multiple project views. There are list views that prioritize tasks, track progress and have task-level data. Kanban boards visualize workload and calendar views offer a monthly overview of projects. Then there are our powerful Gantt charts, which are not a glorified timeline, as with Asana’s, but a tool that schedules tasks, resources and costs, adds milestones and assigns teams. But they go beyond that to link all four types of task dependencies to avoid delays and cost overruns, filter for the critical path without complex and time-consuming calculations and then set a baseline to track progress in real time.
Track Costs with Online Timesheets, Workload Charts and Reports
Our software has other features that keep track of progress, performance and cost. For example, our online timesheets are secure and streamline payroll. However, they also provide a window into labor costs, which are essential to managing to keep projects on budget. When onboarding teams, availability and hourly rates can be set. Workload charts are color-coded to provide an overview of resource allocation. This allows project managers to see who is overallocated or underutilized. They can then balance the workload from that page and keep teams working at capacity without risking burnout. Customizable reports can be generated in a keystroke to provide more data, and they can be shared with stakeholders to keep them updated.
Related Asana Content
Still not convinced that an Asana dashboard isn’t the right project management tool? Maybe it is, maybe it isn’t. More information might be helpful. Check out these recent posts on Asana Gantt charts, how Asana rates against alternatives such as Trello, Monday.com and Microsoft Project.
- Asana Gantt Chart: A How-to Guide With Pros, Cons & Alternatives
- Best Asana Alternatives of 2025 (Free + Paid)
- Asana vs. Microsoft Project: In-Depth Comparison
- Trello vs Asana: Side-by-Side Comparison
- Asana vs. Monday: In-Depth Software Comparison
ProjectManager is online project and portfolio management software that connects teams whether they’re in the office or out in the field. They can share files, comment at the task level and stay updated with email and in-app notifications. Join teams at Avis, Nestle and Siemens who use our software to deliver successful projects. Get started with ProjectManager today for free.
